
Rochdale SpeedometersSM
June 2026
Forward-Looking Six to Nine Months

TRANSCRIPT
We have had an incredible run since the end of March. The rally has been powerful and heavily supported by AI, earnings and business investment. But we just saw the first real sign that the market finally hit a bit of a wall. In one day of trading, the S&P 500 fell 2.6%, the Nasdaq 100 was down almost 5% and a gauge of chipmakers fell 10%. That is a meaningful down draft, especially in the parts of the market that have been carrying leadership. But it is also worth saying that downward moves are normal and they can be healthy for a market advance, a gut check. It allows time to digest gains, reset positioning and test whether prices are still supported by fundamentals.
Our view is that the underlying components of the economy still look very good, but the risks are building on the margins, which is a good way to frame this month’s Speedometers update. The rally lost some steam, but not because earnings collapsed or credit cracked. It lost steam because the market is trying to price several things at once: a stronger labor market, higher yields, the potential for sticky inflation, elevated energy prices, political uncertainty and a coming wave of large AI-related IPOs and equity issuance.
The IPO point is important. SpaceX is expected to come to market this week and Anthropic and OpenAI may follow later in the year. These are not normal IPOs. Eventually, they could add close to $4 trillion in market capitalization to U.S. indexes. That creates a major supply event for the market and it also changes the AI discussion. AI is no longer just a technology or earnings story. It’s becoming an embedded part of the capital markets story — about liquidity, benchmark weights, investor concentration and whether there is enough capital to meet the demand for AI infrastructure.
The other major change is happening on the employment front. The May employment report showed payrolls increasing by 172,000 jobs, the unemployment rate holding at 4.3% and March and April payrolls revised higher by a combined 93,000. That is fundamentally good economic news, but the market reacted negatively because it makes the Fed’s job harder. Good growth is still good, but good growth at a time of sticky inflation and elevated energy prices raises the risk that the Fed cannot cut — and may eventually have to hike.
■ Previous Month ■ Current Month
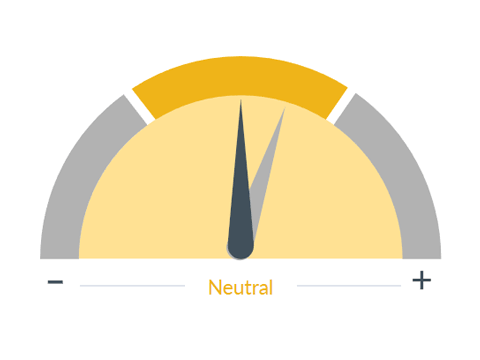
Monetary Policy
What we see
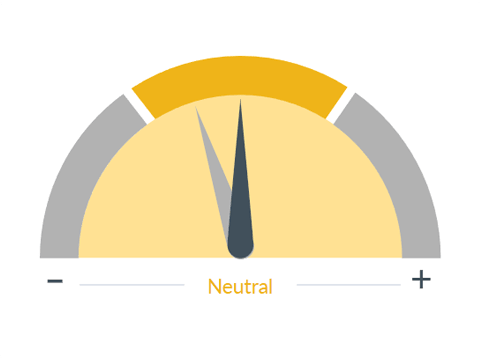
Monetary policy is one of two ways the government can influence the economy and financial markets. By manipulating interest rates, the Federal Reserve can raise or lower the cost of money to stabilize or stimulate the economy. For example, if the cost of credit is reduced, more people and firms will borrow money and the economy will grow. Higher interest rates will increase the cost of its debt, reducing borrowing and company profits, and may slow economic growth.
Dial 1: Monetary Policy, 2:30— That is why we have moved our monetary policy dial down to neutral. The Fed is no longer in a clean easing setup. After Friday’s jobs report, short-term yields moved sharply higher and Fed Fund Futures markets moved toward pricing in a full 25-basis-point hike by December. So, the issue is not simply, “When does the Fed cut?” The more important question is whether stronger growth and sticky inflation eventually force the Fed to tighten.
■ Previous Month ■ Current Month
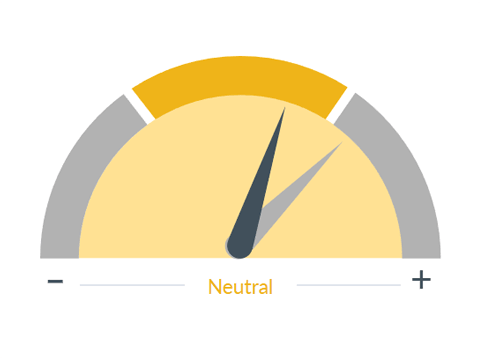
Yield Curve
What we see
The shape of the yield curve gives an idea of future interest rate changes and economic activity. There are three common yield curve shapes: normal, inverted, and flat. A normal yield curve is one in which longer maturity bonds have a higher yield compared to shorter-term bonds, due to the risks associated with time, and can signal improving economic growth. An inverted yield curve is one in which the shorter-term yields are higher than the longer-term yields, which can be a sign of upcoming recession. In a flat or humped yield curve, the shorter- and longer-term yields are very close to each other, which is also a predictor of an economic transition.
Dial 2 & 3: Yield Curve, Interest Rates, 3:00— Alongside this new environment for the Fed, the yield curve and interest rate gauges move down to yellow. Rates are not at crisis levels, but they are no longer a tailwind. After the jobs report, the 10-year was pushing up toward the year’s highs.

■ Previous Month ■ Current Month
Interest Rates
What we see
Interest rates control the flow of money in the economy. High interest rates curb inflation, but also slow down the economy. Low interest rates stimulate the economy, but could lead to inflation. Interest rates affect the economy slowly. When the Federal Reserve changes the Fed Funds rate, it can take 12-18 months for the effect of the change to percolate throughout the entire economy.
The source of this move is real rates rising and a kick up in demand-driven inflation, which is a much bigger problem for the equity market than a temporary energy supply disruption that we’ve seen from the Iranian War.
■ Previous Month ■ Current Month
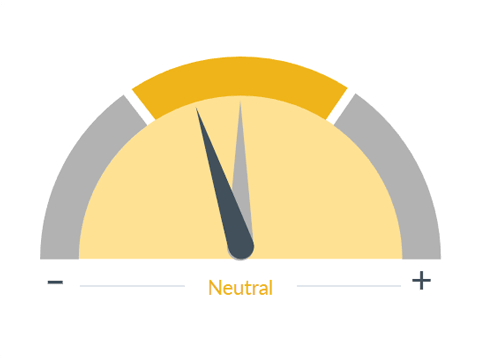
Inflation
What we see
While a slow, persistent rise in prices is consistent with a healthy, growing economy, a rapid increase in inflation, especially if unanticipated, can be harmful. Inflation means higher consumer prices, which often slows sales and reduces profits. Higher prices often lead to higher interest rates. Over time, inflation can also wear away at the value of stocks, which is why it is crucial to monitor.
Dial 4: Inflation, 3:22— That is also why the inflation gauge moves down again. Inflation is not just about the cost of gas. While energy is the most visible pressure point, the April CPI report showed broader concern: Consumer inflation came in just under 4% over the past year and energy prices accounted for most of the move. What concerned us was that core CPI, which excludes energy, is starting to rise faster, and, in particular, housing inflation is creeping back up. The Fed can look through a temporary supply shock, but it can’t ignore a mix of energy, housing and AI-related demand, especially if those pressures start feeding on each other.

■ Previous Month ■ Current Month
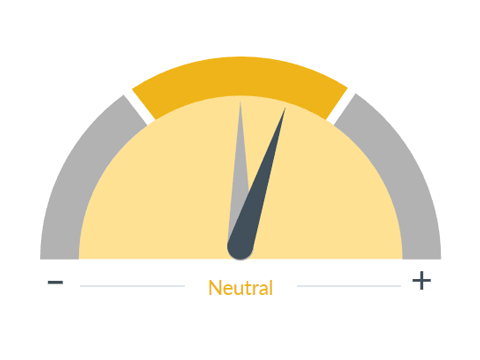
Consumer Spending
What we see
Aggregate level of consumer spending. Since consumers are the largest driver of the U.S. economy, their spending patterns have a large impact on overall economic activity.
Dial 5: Consumer Spending, 4:03— On the consumer side, it is more mixed, but, given the factors in play, the consumer spending gauge moved to neutral. The consumer is still spending, but spending isn’t the clean tailwind it was earlier in the cycle. Real consumption rose only 0.1% and real income fell 0.5%. That tells us inflation is absorbing more of the consumer’s dollars. The lower-income consumer is clearly under more pressure and affordability is becoming more of a constraint. We don’t see this creeping up to wealthier consumers yet, but continued pressure from inflation worries us.
But it’s not all negative.
At the same time, consumer credit is still going strong. The New York Fed’s household debt report showed total household debt was up just 0.1% in the first quarter, with overall delinquency showing little change and early delinquency transitions steady or improving in auto loans, credit cards and mortgages. So, the consumer gauge is moving lower because the trend is less supportive, not because we are seeing a major credit break.
■ Previous Month ■ Current Month
Fiscal Policy
What we see
Changes in tax rates, regulation, and government spending affect the decision-making process of consumers and businesses. By changing tax laws, the government can effectively modify the amount of disposable income available to taxpayers or raise the costs for businesses. However, this process takes time, as the money needs to wind its way through the economy, creating a significant lag between the implementation of fiscal policy and its effect on the economy.
Dial 6: Fiscal Policy, 4:59— Fiscal policy moves up a notch. Fiscal support is still present, even if it is not a new spending boom. Government spending is up 3% from the same period last year and the refund effect from Trump’s signature bill is also helping to offset some pressure on consumers, but we should treat that as support at the margin, not a durable acceleration in demand.
■ Previous Month ■ Current Month
Energy Costs
What we see
Significant changes in energy/oil prices can have important but differing impacts on the overall economy. Higher energy prices act as a tax on consumers and businesses, absorbing money that would normally be used to buy other goods. However, they can also boost production and investment in the mining and energy sectors of the economy. Lower energy prices can increase consumer spending and lower manufacturing costs.
Dial 7: Energy Costs, 4:04— Energy costs move up to neutral. That may sound counterintuitive because energy is still expensive, but the change reflects a better balance of risk than we had at the peak of the shock. The key point is that a partial Hormuz resolution or reopening would likely take the most acute upside pressure out of oil. But it does not mean energy goes back to where it was before the conflict. A new higher floor may emerge as inventories still need to be rebuilt and there are very few practical alternatives if the strait remains closed.
So, our energy view has two parts: First, some resolution or partial reopening could keep oil closer to an $80 to $90 range rather than the extremes. Second, oil probably does not go back to $60 because the global inventory rebuild becomes its own source of demand. That means energy can improve in terms of a market risk, while still remaining a source of inflation this year.

■ Previous Month ■ Current Month
Political Environment
What we see
The overall political climate in the U.S. with a focus on whether it will be supportive or restrictive to economic growth. For instance, while the state of discourse in politics can be tense and deadlocked, it may not be restrictive to growth. Conversely, there could be bipartisan action that is restrictive to growth. It is important to note that this category refers not to the state of discourse, but to the market impact.
Dial 8: Political Enviornment, 6:15— And last: The political environment ahead of the midterms is starting to enter the conversation. There are massive races happening this cycle and voters are facing a variety of issues that could change voting patterns. Consumer sentiment is already reflecting that pressure. The University of Michigan’s Consumer Sentiment Index fell again in May, with current conditions and expectations both weakening. As we move closer to the election cycle, the risk is that economic frustration turns into more policy volatility.
Now, the reason we are not taking a defensive message from the Speedometers is that the strongest supports in the market are still very powerful. Corporate profits are the standout and this earnings season has been exceptionally strong, with S&P 500 earnings outstripping expectations. Technology continues to do the heavy lifting and full-year earnings expectations are still being revised higher. Business investment is also doing a lot of work. Corporate investment across AI infrastructure is helping to offset a slower consumer.
Credit is also still in good shape. Public credit markets are not signaling broad stress, high-yield and investment-grade markets are trading without hiccups and corporate cash flow remains healthy. If credit were deteriorating at the same time the consumer was weakening and rates were moving higher, the message would be very different. But today, the risk side of the dashboard is being offset by earnings, AI investment, business spending and strong credit markets.
So, the Speedometer message this month is that the easy part of the rally is probably behind us. Friday showed that the market can hit an air pocket. The jobs number raised the risk that the Fed may have to stay restrictive for longer, or even hike. Inflation is stickier. Energy is still the swing factor. The consumer is stable, but less supportive. Politics is becoming more important. And the IPO calendar is about to test the market’s ability to absorb a major wave of AI-related equity supply.
The environment is shifting rapidly as it always does during technological changes, but fundamentals still appear good enough to stay invested. The posture is not panic, but it is not complacency, either. We want to respect the rally, respect the risks and be more selective from here. Corrections and drawdowns are normal. The question is whether the fundamentals can support the next leg of the cycle. For now, we believe they can — but the margin for error has narrowed.
Important Information
RBC Rochdale, LLC is an SEC-registered investment adviser and wholly-owned subsidiary of City National Bank. Registration as an investment adviser does not imply any level of skill or expertise. City National Bank is a subsidiary of the Royal Bank of Canada.
The information presented does not involve the rendering of personalized investment, financial, legal or tax advice. This presentation is not an offer to buy or sell, or a solicitation of any offer to buy or sell any of the securities mentioned herein.
Certain statements contained herein may constitute projections, forecasts and other forward-looking statements, which do not reflect actual results and are based primarily upon a hypothetical set of assumptions applied to certain historical financial information. Certain information has been provided by third-party sources and, although believed to be reliable, it has not been independently verified and its accuracy or completeness cannot be guaranteed.
Any opinions, projections, forecasts, and forward-looking statements presented herein are valid as of the date of this document and are subject to change.
Rochdale Speedometers are indicators that reflect forecasts of a 6-to-9-month time horizon. The colors of each indicator, as well as the direction of the arrows represent our positive/negative/neutral view for each indicator. Thus, arrows directed towards the (+) sign represents a positive view which in turn makes it green. Arrows directed towards the (-) sign represents a negative view which in turn makes it red. Arrows that land in the middle of the indicator, in line with the (0), represents a neutral view which in turn makes it yellow. All of these indicators combined affect RBC Rochdale’s overall outlook of the economy.
RBC Rochdale, LLC., its managed affiliates and subsidiaries, as a matter of policy, do not give tax, accounting, regulatory, or legal advice, and any information provided should not be construed as such.
All investing is subject to risk, including the possible loss of the money you invest. As with any investment strategy, there is no guarantee that investment objectives will be met and investors may lose money. Diversification does not ensure a profit or protect against a loss in a declining market. Past performance is no guarantee of future results.
©2026 RBC Rochdale, LLC. All rights reserved.
