

Rochdale SpeedometersSM
November 2026
Forward-Looking Six to Nine Months

TRANSCRIPT
Over the past several weeks, investors have been reminded of something important. A strong economy does not guarantee a smooth stock market. October ended with a particularly difficult trading session, as concerns surrounding corporate earnings, the midterm elections and a major cryptocurrency security breach combined to push investors away from risk. The question now is whether we’re witnessing deterioration in economic conditions or traditional market repricing.
Our view remains constructive, but cautious, as we assess the return potential through the end of this year. Last Friday’s market decline is a great place to start. The S&P 500 fell 1.8%, while the technology-heavy Nasdaq declined nearly 3%. Several developments converged at once. Earnings announcements revived questions about the level of capital being invested in artificial intelligence. Political uncertainty continued to build ahead of yesterday’s elections. And a major security breach at Binance occurred, with over $6.3 billion in cryptocurrency assets stolen.
But there’s an important distinction between what has happened in technology stocks and what has happened across the broader market. Since October 7, the technology sector has declined roughly 10%, communication services nearly 16%, and semiconductor stocks, about 18%. Over that same period, the broader S&P 500 declined less than 3%. That’s a substantial difference. It suggests that we’re experiencing a repricing in some of the market’s most influential companies, while other sectors have absorbed much of the pressure.
Now, this doesn’t mean the repricing is finished. But it does mean we should be careful about interpreting market weakness in technology as evidence that growth is slowing or the economy is weakening. For much of the past two years, companies were rewarded for announcing major investments in AI. Today, investors want to understand when those investments will generate profits and returns. That’s a reasonable question, particularly when interest rates are elevated and the cost of financing new projects is increasing.
We continue to believe that AI represents a significant long-term investment opportunity. There’s a difference between questioning the price of an investment and the long-run value of the underlying opportunity.
On the political front, we’re finally through the midterms, which have been a major source of anxiety for the market, with the potential to disrupt near-term momentum. But we don’t believe investors have been focused enough on the fundamentals. There is a volume of historical evidence that elections act more as a clearing mechanism than a headwind. My anxiety was high until I woke up this morning and realized that, while political gridlock may be in store over the next two years, the market has one less thing to worry about.
This doesn’t erase concerns that have plagued the AI trade over the past few months, including hyperscaler spending, negative free cash flow, the increasing cost of capital and credit concerns. However, as we have been making clear, market returns tend to exceed long-term averages over the 12 months after the midterms.
One thing that we are taking a microscope to is the data center build-out. At a top level, the election result has the potential to disrupt data center development and could slow down the growth of AI, which, in turn, could create a headwind for the market.
There is also the market’s response to potential changes to future tax policy, government debt and the regulatory environment. Over the next two years, a divided government reduces the likelihood of major legislative changes, but it does not eliminate concerns surrounding federal deficits or the growing cost of financing the government. And, while language has improved around Iran at the margin, it’s unclear whether the administration will resume attacks. An escalation could place renewed pressure on energy prices, potentially overshadowing any relief associated with the election.
The big picture is that a major source of market anxiety has been removed. In the short run, that’s positive. But we remind investors that not every risk facing the markets has disappeared.
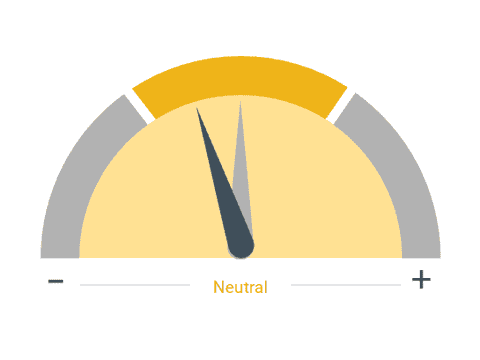
Turning to our November Speedometers, we’ve made five adjustments this month. Four indicators moved modestly lower, while one improved. Importantly, all five remain within our Neutral category.
■ Previous Month ■ Current Month
Monetary Policy
What we see
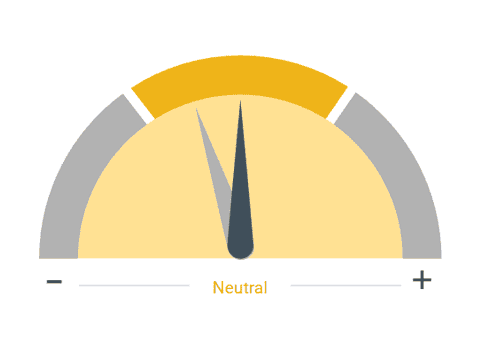
Monetary policy is one of two ways the government can influence the economy and financial markets. By manipulating interest rates, the Federal Reserve can raise or lower the cost of money to stabilize or stimulate the economy. For example, if the cost of credit is reduced, more people and firms will borrow money and the economy will grow. Higher interest rates will increase the cost of its debt, reducing borrowing and company profits, and may slow economic growth.
Dial 1: Monetary Policy, 4:26— Let’s begin with Monetary Policy, which we slightly increased. The Federal Reserve held interest rates steady at its October meeting, and, while another increase remains possible, policymakers have more flexibility to evaluate incoming economic data. A more patient Fed is a welcome development for financial markets.
■ Previous Month ■ Current Month
Consumer Sentiment
What we see
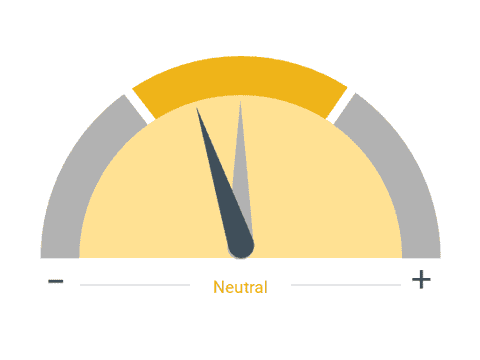
How consumers feel about their overall financial health as well as that of the economy on the short and long term. This is an important indicator, as the consumer is the largest driver of the U.S. economy.
Dial 2: Consumer Sentiment, 4:46— Our second adjustment is to Consumer Sentiment, which we’ve lowered. Consumers remain pessimistic about the economy, particularly inflation and affordability. Yet, the contrast between how consumers feel and what they’re actually doing remains striking. Household spending continues to expand, and companies are still reporting meaningful demand for goods and services. We’ve emphasized this distinction before. Consumer surveys are important, but actual spending provides a more direct measure of economic activity.
■ Previous Month ■ Current Month
Disposable Personal Income
What we see
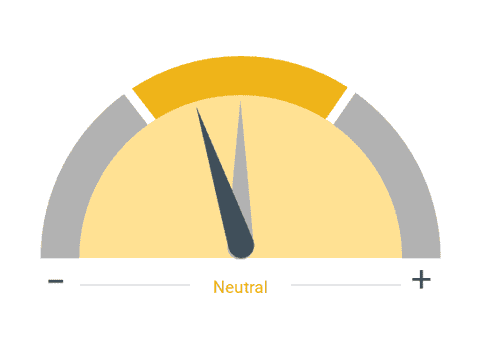
The amount of money households have available for spending and saving after income taxes. A change in a household's real income is by far the most important factor in determining how much that household will spend. Other factors, such as home values or financial savings, matter as well but to a significantly lesser extent.
Dial 3: Disposable Personal Income, 5:20— Our third adjustment is to Disposable Personal Income, which also moved lower. Households continue to face pressure from elevated energy prices and higher borrowing costs. Although consumer spending remains healthy, the financial flexibility available to many families is becoming more limited.
■ Previous Month ■ Current Month
Fiscal Policy
What we see
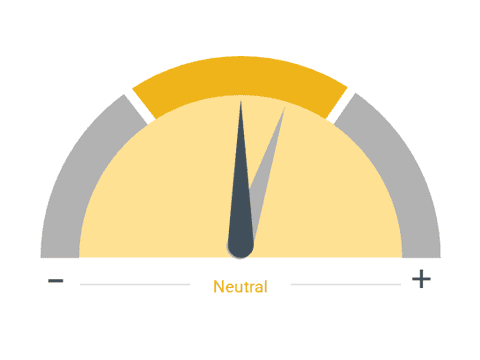
Changes in tax rates, regulation, and government spending affect the decision-making process of consumers and businesses. By changing tax laws, the government can effectively modify the amount of disposable income available to taxpayers or raise the costs for businesses. However, this process takes time, as the money needs to wind its way through the economy, creating a significant lag between the implementation of fiscal policy and its effect on the economy.
Dial 4: Fiscal Policy, 5:36— Our fourth adjustment is to Fiscal Policy, which has moved modestly lower. Persistent federal deficits and elevated Treasury borrowing needs are constraints on government spending that are likely to be magnified by the recent election results. Legislative gridlock could make it harder for policymakers to respond to unexpected economic developments.
■ Previous Month ■ Current Month
Energy Costs
What we see
Significant changes in energy/oil prices can have important but differing impacts on the overall economy. Higher energy prices act as a tax on consumers and businesses, absorbing money that would normally be used to buy other goods. However, they can also boost production and investment in the mining and energy sectors of the economy. Lower energy prices can increase consumer spending and lower manufacturing costs.
Dial 5: Energy Costs, 5:56— Finally, we’ve lowered our Energy Costs Speedometer. The conflict in the Middle East continues to create uncertainty around global energy supplies and transportation. Even as oil shipments have improved and oil prices have come down slightly, the risk of further military escalation has kept energy prices elevated; but there is also an opportunity here. A sustained reduction in energy prices would relieve pressure on consumers, improve business margins and potentially provide the Federal Reserve with additional flexibility.
Stepping back, these five adjustments reflect a somewhat more challenging financial environment, but they do not indicate that an economic contraction is imminent.
Our Business Outlook and Corporate Profit Growth indicators remain Positive, and, while borrowing costs have increased, we have not seen convincing evidence that credit has become broadly unavailable. The economy is still strong.
We expect real U.S. economic growth of 2% to 2.5% in both 2026 and 2027. Corporate profitability remains an important support for financial markets, and we expect profit growth of 25% to 30% in 2026, followed by a slower, but still above trend, growth rate of 15% to 18% in 2027.
We have raised our year-end 2026 inflation forecast to a range of 2.75% to 3.25%, reflecting the impact of energy costs and other persistent price pressures, but we continue to believe inflation’s run rate will slow over 2027. We also expect longer-term interest rates to remain relatively elevated, with our 2026 forecast for the 10-year Treasury between 4.75% and 5.25%.
So, what does all of this mean for investors? We moved overweight equities in late August, including increasing our exposure to U.S. large-cap stocks and emerging markets, and we continue to support that position. The conditions for economic expansion are largely intact.
At the same time, we’re not ignoring the market’s warning signs. The correction in technology stocks has been meaningful. Higher interest rates are making investors less tolerant of disappointing earnings, and geopolitical developments could introduce additional volatility.
Knowing that, we’re watching whether weakness begins to spread beyond technology into consumer spending, corporate earnings expectations and broader credit conditions. Those developments would give us more reason to reconsider our outlook. For now, we believe the appropriate response is greater selectivity and a more cautious assessment of risk, rather than a broad retreat from equities.
We also recognize that some of today’s uncertainties have the potential to resolve favorably.
Important Information
RBC Rochdale, LLC is an SEC-registered investment adviser and wholly-owned subsidiary of City National Bank. Registration as an investment adviser does not imply any level of skill or expertise. City National Bank is a subsidiary of Royal Bank of Canada.
The information presented does not involve the rendering of personalized investment, financial, legal or tax advice. This presentation is not an offer to buy or sell, or a solicitation of any offer to buy or sell any of the securities mentioned herein.
Certain statements contained herein may constitute projections, forecasts and other forward-looking statements, which do not reflect actual results and are based primarily upon a hypothetical set of assumptions applied to certain historical financial information. Certain information has been provided by third-party sources and, although believed to be reliable, it has not been independently verified and its accuracy or completeness cannot be guaranteed.
Any opinions, projections, forecasts, and forward-looking statements presented herein are valid as of the date of this document and are subject to change.
Rochdale Speedometers are indicators that reflect forecasts of a 6-to-9-month time horizon. The colors of each indicator, as well as the direction of the arrows represent our positive/negative/neutral view for each indicator. Thus, arrows directed towards the (+) sign represents a positive view which in turn makes it green. Arrows directed towards the (-) sign represents a negative view which in turn makes it red. Arrows that land in the middle of the indicator, in line with the (0), represents a neutral view which in turn makes it yellow. All of these indicators combined affect RBC Rochdale’s overall outlook of the economy.
RBC Rochdale, LLC, its managed affiliates and subsidiaries, as a matter of policy, do not give tax, accounting, regulatory, or legal advice, and any information provided should not be construed as such.
All investing is subject to risk, including the possible loss of the money you invest. As with any investment strategy, there is no guarantee that investment objectives will be met and investors may lose money. Diversification does not ensure a profit or protect against a loss in a declining market. Past performance is no guarantee of future results.
©2026 RBC Rochdale, LLC. All rights reserved.