

Rochdale SpeedometersSM
September 2026
Forward-Looking Six to Nine Months

TRANSCRIPT
As we move into September, there’s still plenty for investors to worry about. We have geopolitical risk, volatile interest rates, a difficult fiscal backdrop and midterm elections getting closer. But when we look past the headlines and focus on the economic data, the picture has actually improved.
Growth has strengthened, corporate earnings have been exceptionally good, business investment remains strong and the recent inflation data have become more encouraging. That combination led us to make several changes to the Speedometers this month.
■ Previous Month ■ Current Month
Business Outlook Spending/Surveys
What we see
Surveys of the business community on current and expected trends. This is a gauge on businesses' spending plans that provides an insight into wages, inflation, and capital equipment spending.
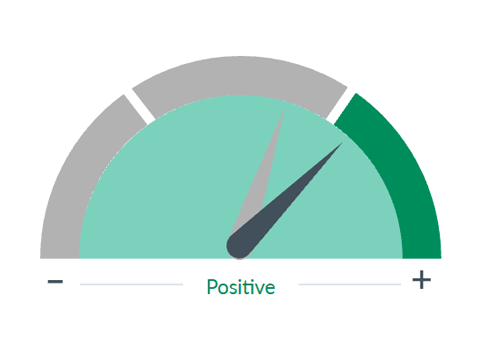
Dial 1: Business Outlook Spending/Surveys, 0:50— The most significant change was an upgrade to our Business Outlook and Spending Surveys Speedometer, which moved into the green.
We have been watching corporate investment closely because so much of the current expansion is tied to technology spending, particularly artificial intelligence and data-center development. The question has been whether that investment would stay concentrated in a relatively small group of companies or start to benefit the broader economy. So far, we think the answer is clear: It’s spreading well beyond the technology sector.
Capital spending remains very strong, manufacturing surveys have improved considerably and businesses are becoming more constructive about future investment. Federal Reserve districts are also reporting increased manufacturing activity and growth in data centers, defense and construction.
This reinforces the view that the AI investment cycle is beginning to reach well beyond the technology companies themselves. It is supporting manufacturing, construction, power infrastructure and an expanding network of industries connected to that buildout.
Corporate profits provide additional support. Second-quarter earnings grew more than 30%, margins remained extremely strong and earnings estimates have continued to move higher. That's unusual. Analysts typically reduce estimates as the year progresses, but so far, we're seeing the opposite.
So, the reason for the upgrade is fairly straightforward: Strong corporate investment is increasingly translating into broader economic activity.
■ Previous Month ■ Current Month
Inflation
What we see
While a slow, persistent rise in prices is consistent with a healthy, growing economy, a rapid increase in inflation, especially if unanticipated, can be harmful. Inflation means higher consumer prices, which often slows sales and reduces profits. Higher prices often lead to higher interest rates. Over time, inflation can also wear away at the value of stocks, which is why it is crucial to monitor.
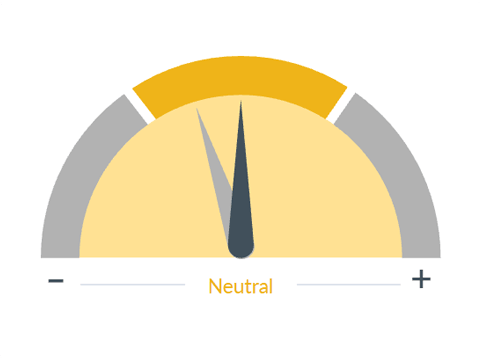
Dial 2: Inflation, 2:14— Our second change was to inflation, which we upgraded by one notch.
That does not mean inflation is back to the Fed's 2% target, and there are still risks. But compared with where we were several months ago, we think the probability of another significant inflation breakout has declined.
Some of the year-over-year inflation readings remain elevated because they still include the earlier effects of higher energy prices and geopolitical disruptions. The more recent data has been better. Core inflation is trending lower and wage growth has continued to cool. While prices in some areas are still rising, particularly for energy, transportation and raw materials, there are few indications of broad overheating. Some companies are actually finding it difficult to pass higher costs along because their customers have become more price sensitive.
So, while inflation remains above the Fed's target, today's environment looks very different from 2022. Fiscal stimulus is not flooding into household balance sheets, the Federal Reserve isn't plowing stimulus into the economy and many of the supply problems that contributed to the earlier inflation surge have normalized.
Energy and geopolitics remain the major swing factors, so we are not dismissing the risk. We simply think the inflation outlook has improved enough to justify moving that Speedometer to neutral.
■ Previous Month ■ Current Month
Yield Curve
What we see
The shape of the yield curve gives an idea of future interest rate changes and economic activity. There are three common yield curve shapes: normal, inverted, and flat. A normal yield curve is one in which longer maturity bonds have a higher yield compared to shorter-term bonds, due to the risks associated with time, and can signal improving economic growth. An inverted yield curve is one in which the shorter-term yields are higher than the longer-term yields, which can be a sign of upcoming recession. In a flat or humped yield curve, the shorter- and longer-term yields are very close to each other, which is also a predictor of an economic transition.
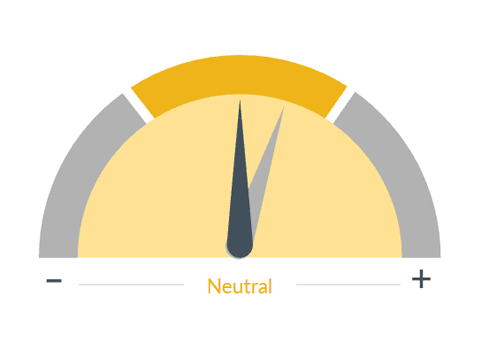
Dial 3: Yield Curve, 3:31— That leads naturally into the Yield Curve Speedometer, which we moved slightly lower.
This change reflects the pressure we've seen in longer-term interest rates. There has been a lot of discussion recently about the term premium, which is simply the additional return investors want for committing money to a longer-term Treasury bond. That premium has increased as markets price in uncertainty surrounding inflation, government borrowing, Treasury supply, global interest rates and the future path of Federal Reserve policy. We agree that those factors matter, particularly the fiscal outlook. But there is another reason long-term yields can rise: Stronger economic growth.
Nominal economic activity has accelerated and when the economy is growing faster, investors generally demand a higher return to own long-duration bonds. So, we don't interpret every move higher in Treasury yields as evidence that the bond market is signaling economic trouble.
The challenge is that the Federal Reserve has much more influence over short-term rates than it does over the long end of the curve. Even if the Fed eventually eases policy, longer-term yields can remain elevated if growth is strong or investors continue to demand additional compensation for uncertainty. For that reason, we think the longer end of the Treasury market warrants a little more caution.
■ Previous Month ■ Current Month
Political Environment
What we see
The overall political climate in the U.S. with a focus on whether it will be supportive or restrictive to economic growth. For instance, while the state of discourse in politics can be tense and deadlocked, it may not be restrictive to growth. Conversely, there could be bipartisan action that is restrictive to growth. It is important to note that this category refers not to the state of discourse, but to the market impact.
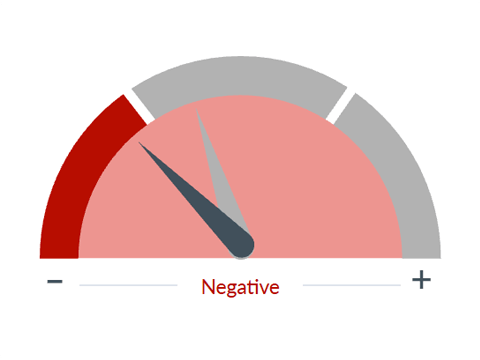
Dial 4: Political Environment, 4:45— Our final change this month was a downgrade to the Political Environment Speedometer.
This is not an election forecast, and it is not a judgment about either political party. We are simply getting closer to the midterm elections and historically that means policy uncertainty begins to increase.
A number of economically important issues are becoming part of the political debate, including taxes, trade, energy policy, government spending and the rapid development of AI infrastructure. As that debate becomes more intense, companies have less clarity about the rules they may be operating under next year.
We think that uncertainty is worth flagging as we move toward year-end. Once the elections are behind us and there is greater visibility around policy, there is a reasonable path for that Speedometer to improve again.
Putting all of this together, our economic outlook remains positive.
The U.S. economy is growing and corporate spending is providing an important tailwind while earnings and market multiples continue to support equity markets. Consumer spending has also remained resilient, and going into the jobs number tomorrow, the labor market looks stable. At the same time, we recognize that the risks have not gone away. Geopolitics, government debt, long-term interest rates and political uncertainty all have the potential to create volatility.
September itself can also be a difficult month for markets. But our central view is that the underlying economy is stronger than many of the headlines suggest. As long as growth continues to support corporate earnings, we believe that remains a favorable backdrop for investors.
Important Information
RBC Rochdale, LLC is an SEC-registered investment adviser and wholly-owned subsidiary of City National Bank. Registration as an investment adviser does not imply any level of skill or expertise. City National Bank is a subsidiary of Royal Bank of Canada.
The information presented does not involve the rendering of personalized investment, financial, legal or tax advice. This presentation is not an offer to buy or sell, or a solicitation of any offer to buy or sell any of the securities mentioned herein.
Certain statements contained herein may constitute projections, forecasts and other forward-looking statements, which do not reflect actual results and are based primarily upon a hypothetical set of assumptions applied to certain historical financial information. Certain information has been provided by third-party sources and, although believed to be reliable, it has not been independently verified and its accuracy or completeness cannot be guaranteed.
Any opinions, projections, forecasts, and forward-looking statements presented herein are valid as of the date of this document and are subject to change.
Rochdale Speedometers are indicators that reflect forecasts of a 6-to-9-month time horizon. The colors of each indicator, as well as the direction of the arrows represent our positive/negative/neutral view for each indicator. Thus, arrows directed towards the (+) sign represents a positive view which in turn makes it green. Arrows directed towards the (-) sign represents a negative view which in turn makes it red. Arrows that land in the middle of the indicator, in line with the (0), represents a neutral view which in turn makes it yellow. All of these indicators combined affect RBC Rochdale’s overall outlook of the economy.
RBC Rochdale, LLC, its managed affiliates and subsidiaries, as a matter of policy, do not give tax, accounting, regulatory, or legal advice, and any information provided should not be construed as such.
All investing is subject to risk, including the possible loss of the money you invest. As with any investment strategy, there is no guarantee that investment objectives will be met and investors may lose money. Diversification does not ensure a profit or protect against a loss in a declining market. Past performance is no guarantee of future results.
©2026 RBC Rochdale, LLC. All rights reserved.



 Top
Top