

Videos › Economic Perspectives › July 2026
-
Economic Perspectives
The Five Fed Task Forces
July 2026
- Filename
- Economic Perspectives July 2026.pdf
- Format
- application/pdf

TRANSCRIPT
This past May, Kevin Warsh took the helm as the 17th Chair of the Federal Reserve. He is eager to make some changes in policies and procedures regarding the Fed’s current approach to monetary policy. He believes an overhaul is needed because past policies are responsible for current inflation, which has been above target for more than five years.
He has created five task forces to carefully consider whether policymakers’ methods, analytical tools and policy approaches can be improved.
The goal is straightforward: to ensure that the Fed is best positioned to achieve its objectives in this consequential time.
Each of the task forces is being led by prominent academics, former central bankers and well-established business leaders. All of them have deep expertise in their fields. They are experienced and thoughtful and understand the nuances.
Let’s look at some slides.
The Fed Launches Task Forces
Data current as of: July 23, 2026
Source: Federal Reserve
Information is subject to change and is not a guarantee of future results.
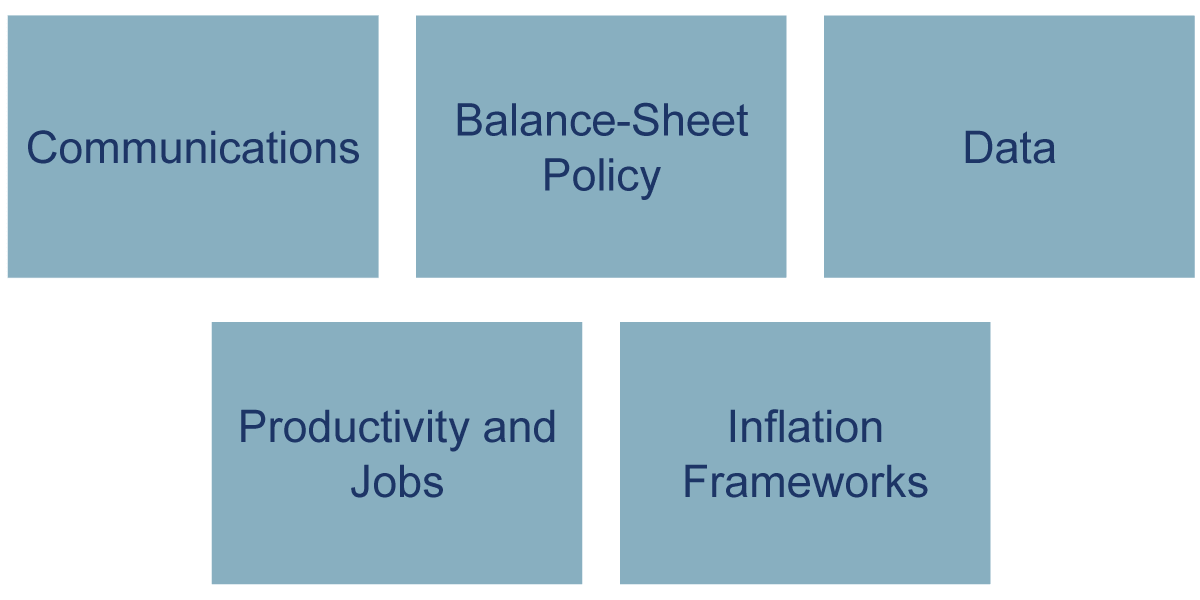
Chart 1, 1:11– The five task forces are: Communications, balance-sheet policy, data, productivity and jobs, and finally, inflation frameworks.
Communications
Review how the Federal Reserve conveys policy deliberations and decisions amid uncertainty.
Peter R. Fisher, U.S. Treasury, Under Secretary for Domestic Finance
Arminio Fraga, Brazil Central Bank, Former President
Mervyn King, Bank of England, Governor
Data as of: July 23, 2026
Source: Federal Reserve, RBC Rochdale Research
Information is subject to change and is not a guarantee of future results.
Chart 2, 1:22– Each of these five task force slides includes the objective. If of interest, also included are the three external advisors who will work with the Fed staff. Also included are their current jobs or what they are best known for.
Regarding communication, Kevin Warsh believes Fed policymakers currently communicate too much. There are 18 members of the FOMC, all with their own opinions.
For a little history on Fed communications, the Fed used to be very opaque. It wasn't until 1994, when Alan Greenspan was the Chair, that the Fed announced its rate decisions following the meetings. Before then, Fed watchers monitored the money markets to see whether the Fed had changed policy and by how much. Then, during the global financial crisis, Ben Bernanke really increased transparency. In 2011, he started holding press conferences after each FOMC meeting; in 2012, he began publishing the dot plots for future expectations of the federal funds rate; and in 2012, he formally set 2.0% as the inflation target.
Kevin Warsh believes the extra transparency was needed at the time, given the severity of the economic downturn. The public needed to know that interest rates would remain low for a long time. But in times like we are experiencing now, he believes the Fed should spend more time getting policy right.
Balance-Sheet Policy
Examine the costs, benefits, and institutional implications of the Federal Reserves current balance sheet regime.
Karen Dynan, U.S. Treasury, Chief Economist
Raghuram Rajan, International Monetary Fund, Chief Economist
Jeremy Stein, Federal Reserve Bank, Board of Governors, 2012-2014
Data as of: July 23, 2026
Source: Federal Reserve, RBC Rochdale Research
Information is subject to change and is not a guarantee of future results.
Chart 3, 2:50– Warsh is not a fan of the large-sized balance sheet that the Fed is running. So he wants it investigated. There is a belief that the large balance sheet causes distortions in the financial markets. For example, some economists believe the Fed’s massive buying of Treasury securities during the pandemic pushed down longer-term interest rates, including mortgage rates. This caused demand for homes to skyrocket, putting upward pressure on home prices.
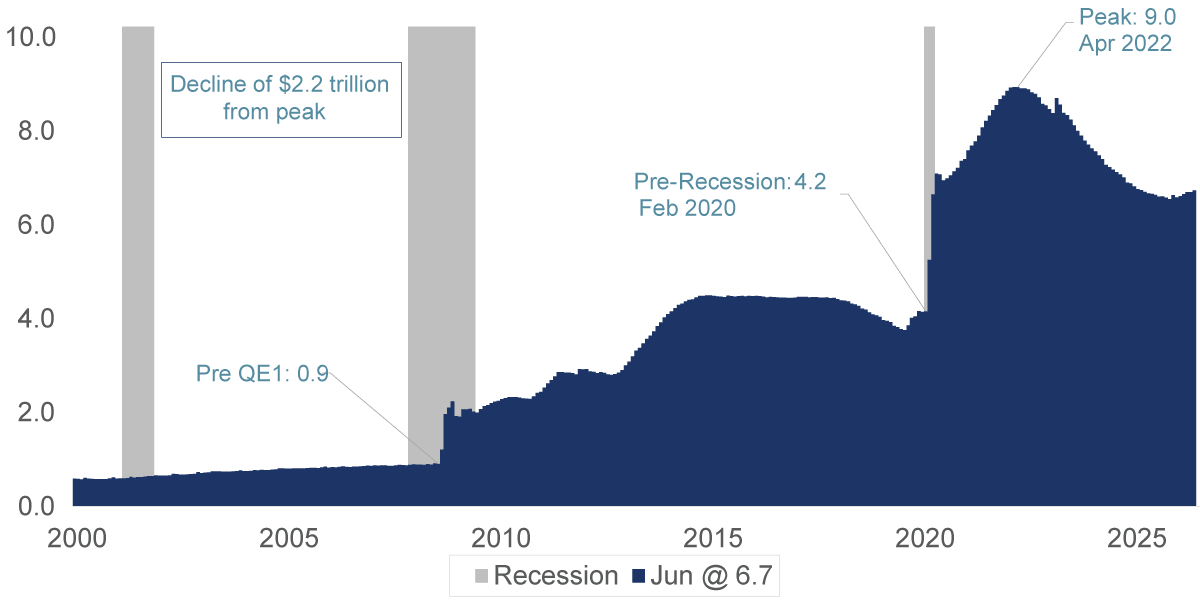
Federal Reserve Balance Sheet
$, trillions, not seasonally adjusted
Data current as of: July 23, 2026
Source: Federal Reserve
Information is subject to change and is not a guarantee of future results.
Chart 4, 3:19– Here is a chart of the size of the Fed’s balance sheet since 2000. It was just $900 billion prior to the start of quantitative easing. The Fed continued buying bonds, which added reserves to the banking system, until 2018, when the economy normalized and they could start reducing the size of their balance sheet. Then the pandemic came and the Fed quickly doubled the balance sheet to $9 trillion. Then, four years ago, when the economy normalized, they began reducing the size again.
The Fed has kept the balance sheet large, which means there are a lot of reserves in the banking system. All that money sloshing around in the banking system allows for plenty of liquidity to handle the day-to-day needs of the financial system. This reduces the number of times the Fed has to add or drain reserves in the market to keep the funds rate steady.
Data
Improve the quality and timeliness of real economic signals that inform the Federal Reserves policy judgement.
Raj Chetty, Harvard University, Professor of Public Economics
Doug McMillon, Walmart, former President and CEO
Kevin M. Murphy, Hoover Institute, Senior Fellow
Data as of: July 23, 2026
Source: Federal Reserve, RBC Rochdale Research
Information is subject to change and is not a guarantee of future results.
Chart 5, 4:12– Data: For the Fed, it's all about the data. They need accurate and timely data so they can decide on the appropriate level of monetary policy changes. They address the limitations of some government data that rely on old-fashioned surveys that have declining response rates and large revisions. They will also examine the use of private-sector data that uses real-time information, such as daily credit card transactions to follow consumer spending.
Productivity & Jobs
Examine the costs, benefits, and institutional implications of the Federal Reserves current balance sheet regime.
Marc Andreessen, Andreessen Horowitz, Cofounder and General Partner
Charles I. Jones, Stanford University, Professor of Economics
Asha Sharma, Microsoft Corp., EVP and Chief Executive Officer of XBOX
Data as of: July 23, 2026
Source: Federal Reserve, RBC Rochdale Research
Information is subject to change and is not a guarantee of future results.
Chart 6, 4:41– Productivity and Jobs: This is an exciting task force in terms of objectives and members. They will assess how technological improvements, like artificial intelligence, will impact the economy, most notably with inflation and employment.
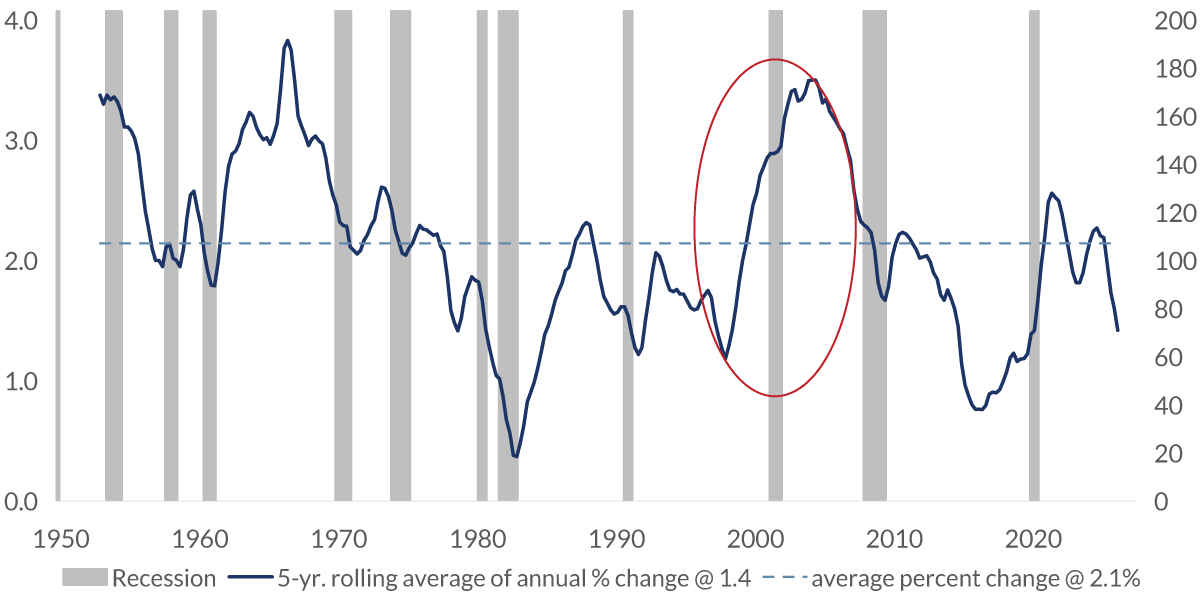
Labor Productivity
index value, seasonally adjusted
Data current as of: July 23, 2026
Source: Bureau of Labor Statistics
Information is subject to change and is not a guarantee of future results.
Chart 7, 4:57– Warsh often talks about the increase in labor productivity in the late 1990s and early 2000s when the internet was new, which brought rapid advancements in information technology, including spreadsheets and word processing. Higher levels of productivity can help keep a lid on inflation.
Inflation Frameworks
Assess Revisit how the Federal Reserve understands and responds to drivers of inflation
Greg Mankiw, President’s Council of Economic Advisers, Chairman
Thomas Sargent, Nobel Laureate
William White, Bank of International Settlements
Data as of: July 23, 2026
Source: Federal Reserve, RBC Rochdale Research
Information is subject to change and is not a guarantee of future results.
Chart 8, 5:15– With inflation above its target rate of 2.0% for more than five years, this is an important issue for the Fed.
This group will analyze the key drivers of inflation. They will also recommend a wide range of ideas on ways to ensure price stability.
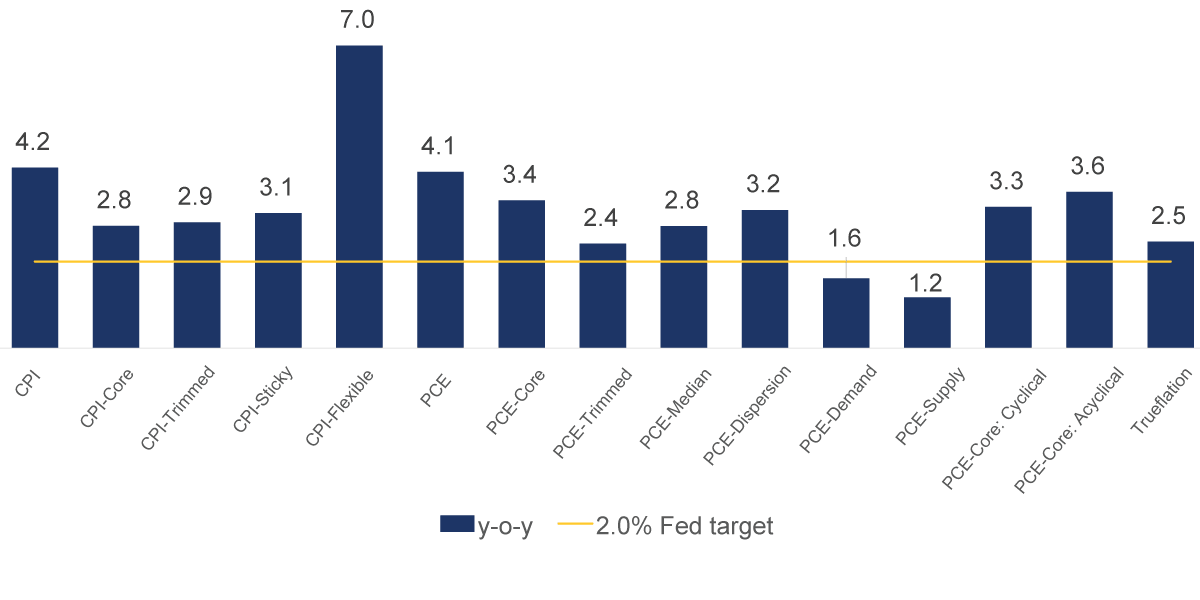
Inflation: Various Metrics
%, seasonally adjusted annual rates as of May 2026
Data current as of: July 23, 2026
Source: Bureau of Labor Statistics, Bureau of Economic Analysis, Federal Reserve Banks of Atlanta, Cleveland, Dallas, and San Francisco, Truflation.com
Information is subject to change and is not a guarantee of future results.
Chart 9, 5:30– Measuring inflation is tricky, since there is no single way to measure it accurately. This chart shows the annual change in inflation for many of the inflation measurements that Fed policymakers look at to understand what is causing inflation and how long those pressures may last.
Warsh has talked several times about finding a different measurement of inflation that the Fed should follow.
As for the timeline, the results are expected in the next six to nine months, which some economists view as aggressive. The results are not binding. All policy decisions rest with the 18 members of the FOMC. And once the recommendations are agreed upon, we expect the implementation will be evolutionary, not revolutionary - changes to monetary policy can’t be too swift, as it may increase uncertainty and market volatility, which the Fed wants to avoid.
This is an exciting time for the Fed. These panelists are expected to offer bold initiatives to modernize its operations.
Important Information
The views expressed represent the opinions of RBC Rochdale, LLC which are subject to change and are not intended as a forecast or guarantee of future results. Stated information is provided for informational purposes only, and should not be perceived as personalized investment, financial, legal or tax advice or a recommendation for any security. It is derived from proprietary and non-proprietary sources which have not been independently verified for accuracy or completeness. While RBC Rochdale believes the information to be accurate and reliable, we do not claim or have responsibility for its completeness, accuracy, or reliability. Statements of future expectations, estimates, projections, and other forward-looking statements are based on available information and management's view as of the time of these statements. Accordingly, such statements are inherently speculative as they are based-on assumptions which may involve known and unknown risks and uncertainties. Actual results, performance or events may differ materially from those expressed or implied in such statements.
All investment strategies have the potential for profit or loss; changes in investment strategies, contributions or withdrawals may materially alter the performance and results of a portfolio. Different types of investments involve varying degrees of risk, and there can be no assurance that any specific investment will be suitable or profitable for a client's investment portfolio.
RBC Rochdale, LLC is an SEC-registered investment adviser and wholly-owned subsidiary of City National Bank. Registration as an investment adviser does not imply any level of skill or expertise. City National Bank is a subsidiary of Royal Bank of Canada.
© 2026 RBC Rochdale, LLC. All rights reserved.
Stay Informed.
Get our Insights delivered straight to your inbox.
Check out previous perspectives:
Put our insights to work for you.
If you have a client with more than $1 million in investable assets and want to find out about the benefits of our intelligently personalized portfolio management, speak with an investment consultant near you today.
If you’re a high-net-worth client who's interested in adding an experienced investment manager to your financial team, learn more about working with us here.



 Top
Top