
Videos › Economic Perspectives › June 2026
-
Economic Perspectives
The Monthly Labor Report – Leading Indicators
June 2026
- Filename
- Economic Perspectives June 2026.pdf
- Format
- application/pdf

TRANSCRIPT
Last month was the first of two installments covering the monthly labor report. This month, we will explore some of the leading indicators that economists use to formulate their forecasts of labor demand and the pace of economic growth.
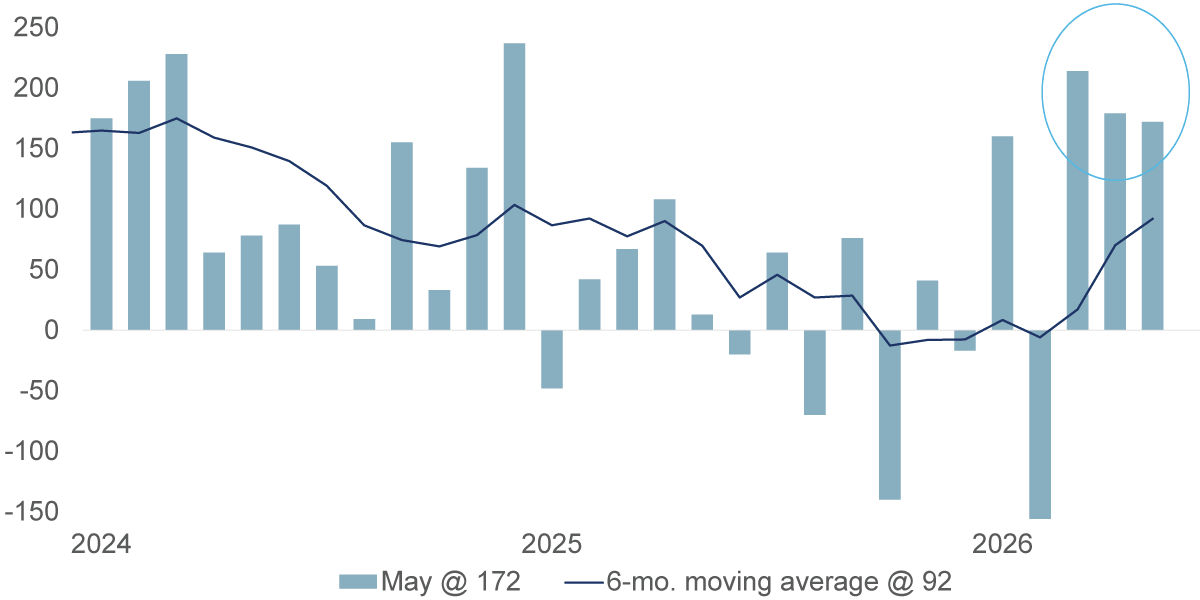
Before that, I have just a few comments on the May labor report that was released in early June. The most notable was the strength in nonfarm payrolls, which grew by 172,000, slightly more than twice the market’s expectation. Furthermore, the two previous months were revised upward by 93,000.
Nonfarm Payrolls
'000, seasonally adjusted
Data current as of: June 24, 2026
Source: Bureau of Labor Statistics
Information is subject to change and is not a guarantee of future results.
Chart 1, 0:49– In this chart, the columns are the monthly change. You can see that in the past three months has been much stronger than recent history, lifting the trend rate of the six-month moving average to 92,000, which is represented by the dark blue line. Recent data have shifted the trajectory toward a positive trend.
That is much stronger than the near-zero growth in the trend rate observed in the first quarter of this year and the fourth quarter of last year. This growth has allowed the Fed to focus on the inflation side of its dual mandate of keeping inflation and unemployment low and stable. There is no longer the immediate need to lower interest rates.
Now, for some of the leading indicators of the labor market.
Initial Claims for Unemployment Insurance
'000, seasonally adjusted
Data current as of: June 24, 2026
Source: The Labor Department
Information is subject to change and is not a guarantee of future results.
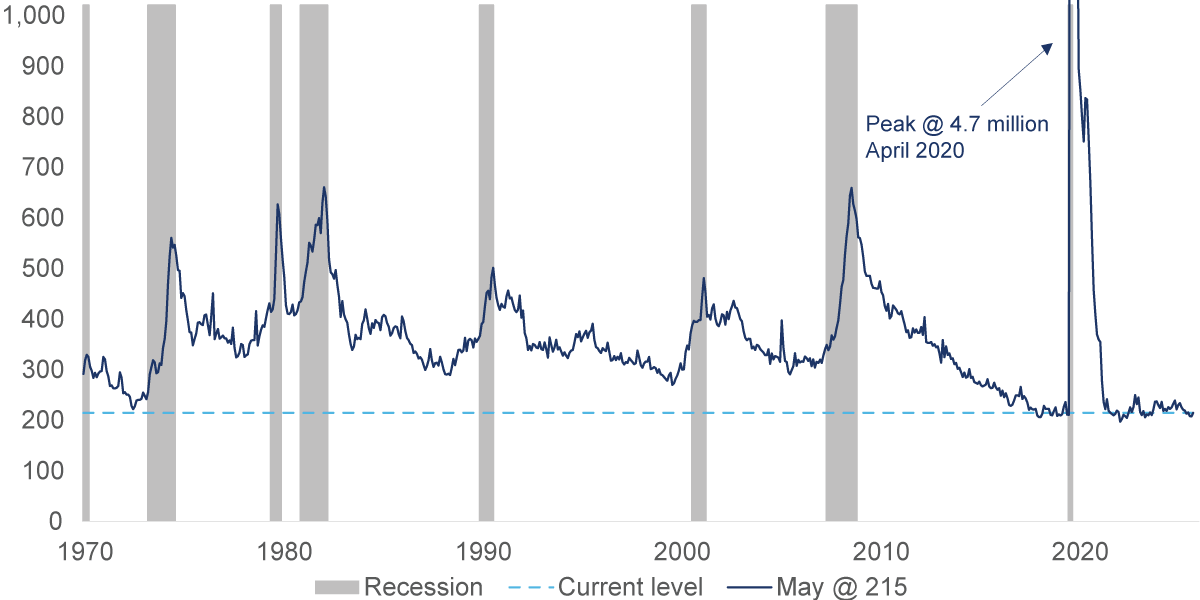
Chart 2, 1:37– The favorite among economists is this chart. It shows the number of people filing their initial unemployment insurance claims, which happens right after they've been laid off from a job. What economists like about this report is its timeliness. It is released on Thursday mornings based on data from the previous week. So the near-instantaneous data on employer behavior can be used to gauge shifts in labor demand. When this claim number is low, as it is now, it signals that businesses have sufficient strength and do not need to lay off their workforce. Of course, if this report shows an increase, it suggests businesses are likely experiencing a slowdown in demand or financial stress.
In this chart, you can see that claims have been hovering at low levels not seen since the early 1970s. This is not surprising considering the strength of the economy. What makes that more impressive is that, back in the 1970s, the workforce was about half its current size. So, as a percent of those working, the amount of people making claims for unemployment insurance is only about 0.1%, half the level it was back in the early 1970s.
Initial Claims for Unemployement Insurance
'000, seasonally adjusted
Data as of: June 24, 2026
Source: The Labor Department
Information is subject to change and is not a guarantee of future results.
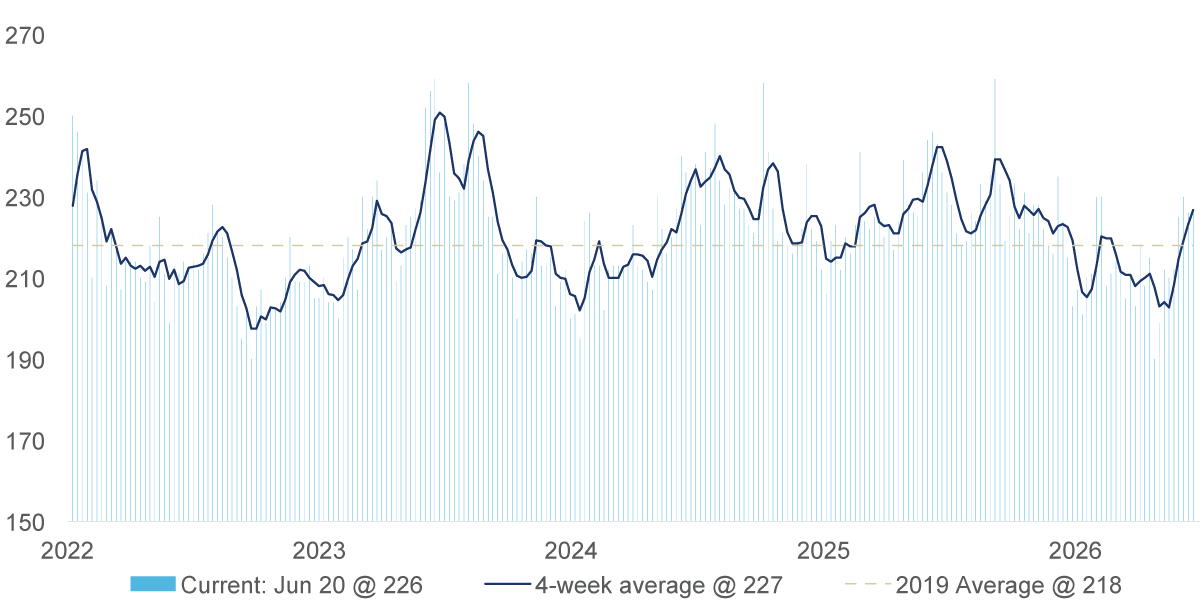
Chart 3, 2:58– This is a more contemporary view of the data. The columns are the weekly data, while the dark blue line is a four-week moving average. The data can be volatile on a weekly basis due to factors such as weather or holidays. It is also subject to revisions. So economists tend to follow the trend by watching the four-week moving average.
Job Openings
millions, seasonally adjusted
Data current as of: June 24, 2026
Source: Bureau of Labor Statistics
Information is subject to change and is not a guarantee of future results.
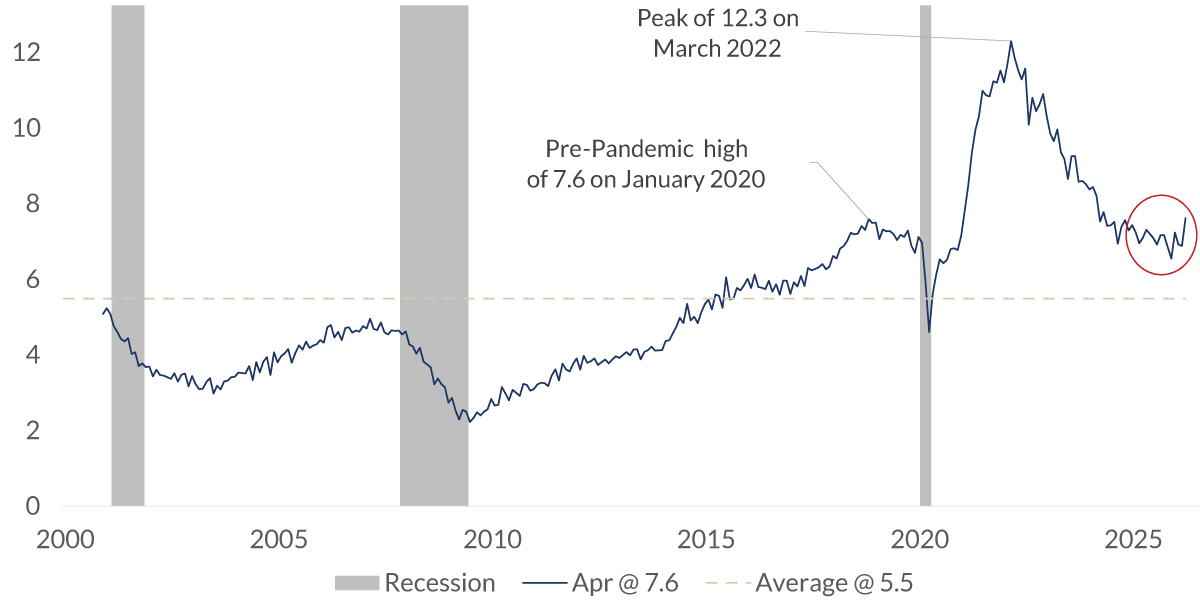
Chart 4, 3:19– Another important report is the JOLTS report, which is an acronym for Job Openings and Labor Turnover Survey. It is a monthly report from the Bureau of Labor Statistics. Its primary dataset shows that the number of job openings, which currently stands at 7.6 million, is well above the long-term average of 5.5 million. Yes, it is below the 2022 peak of 12.3 million, but those were extreme times when businesses were looking to hire back many of the nearly 22 million people who lost their jobs during the pandemic. You can see on the right-hand side that there has been a slight pickup in openings to the pre-recession high of 7.6 million; indicating growing demand.
There is plenty of other data we look at, like from the private sector. The Indeed’s job postings is a good example, or the purchasing managers index on hiring plans for manufacturing and service businesses, or whether orders are picking up or dropping off; these can be indicators of future demand.
All of this goes into our analysis of the state of labor demand. Our current view is that demand is strong enough to help keep the unemployment rate, hovering around the current level low level of 4.3%, allowing the economy to continue to grow.
Important Information
The views expressed represent the opinions of RBC Rochdale, LLC which are subject to change and are not intended as a forecast or guarantee of future results. Stated information is provided for informational purposes only, and should not be perceived as personalized investment, financial, legal or tax advice or a recommendation for any security. It is derived from proprietary and non-proprietary sources which have not been independently verified for accuracy or completeness. While RBC Rochdale believes the information to be accurate and reliable, we do not claim or have responsibility for its completeness, accuracy, or reliability. Statements of future expectations, estimates, projections, and other forward-looking statements are based on available information and management's view as of the time of these statements. Accordingly, such statements are inherently speculative as they are based-on assumptions which may involve known and unknown risks and uncertainties. Actual results, performance or events may differ materially from those expressed or implied in such statements.
All investment strategies have the potential for profit or loss; changes in investment strategies, contributions or withdrawals may materially alter the performance and results of a portfolio. Different types of investments involve varying degrees of risk, and there can be no assurance that any specific investment will be suitable or profitable for a client's investment portfolio.
RBC Rochdale, LLC is an SEC-registered investment adviser and wholly-owned subsidiary of City National Bank. Registration as an investment adviser does not imply any level of skill or expertise. City National Bank is a subsidiary of Royal Bank of Canada.
© 2026 RBC Rochdale, LLC. All rights reserved.
Stay Informed.
Get our Insights delivered straight to your inbox.
Check out previous perspectives:


Put our insights to work for you.
If you have a client with more than $1 million in investable assets and want to find out about the benefits of our intelligently personalized portfolio management, speak with an investment consultant near you today.
If you’re a high-net-worth client who's interested in adding an experienced investment manager to your financial team, learn more about working with us here.
