
-
Fixed Income Perspectives
Bonds Anchored Despite Rate Volatility
June 2026
- Filename
- Fixed Income Perspectives June 2026.pdf
- Format
- application/pdf

TRANSCRIPT
As mid-year approaches, fixed income investors have managed the dual challenges of rising yields and heightened market volatility. After a strong start to the year, bond returns have been pressured by renewed inflation concerns tied to geopolitical tensions in Iran, shifting expectations around Fed easing, and rising federal deficit spending. At the same time, the U.S. economy has shown resilience with slowing but steady growth, and a firming labor market has provided a stabilizing backdrop.
Year to Date Fixed Income Broad Index Total Returns
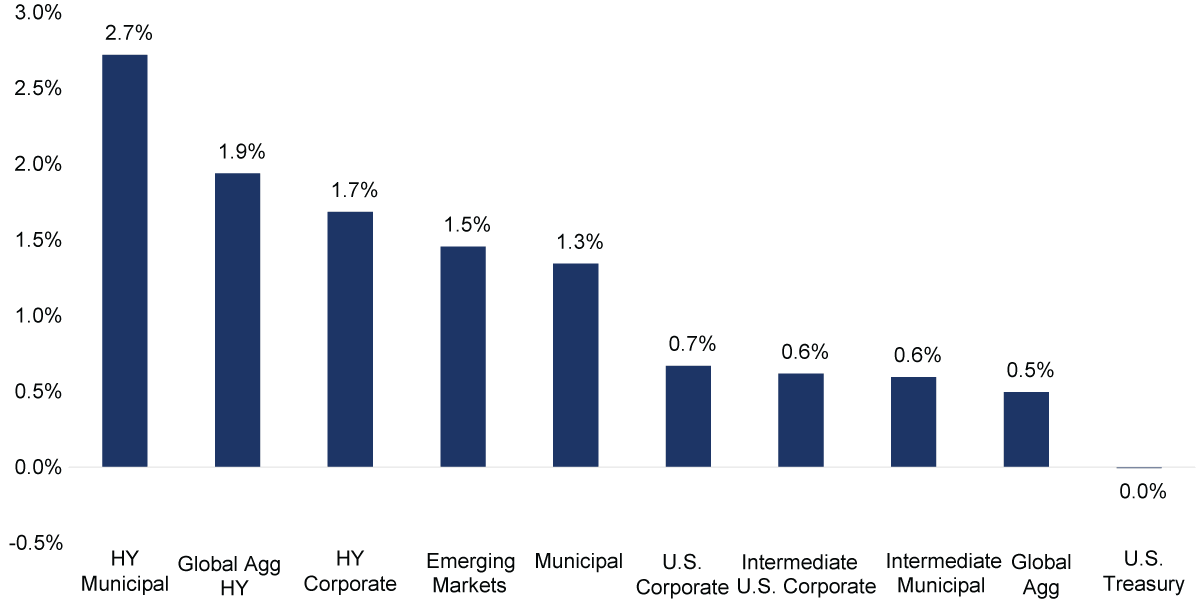
HY Municipal is the Bloomberg Municipal Bond: High Yield Index. Global Agg HY is the Bloomberg Global High Yield Index. HY Corporate is the Bloomberg US Corporate High Yield Index USD. Municipal is the Bloomberg Municipal Bond Index. Emerging Markets is the Bloomberg EM USD Aggregate Index. Intermediate US Corporate is the Bloomberg Intermediate Corporate Index. Intermediate Municipal is the Bloomberg Municipal Bond Inter-Short 1-10Y TR Index. US Corporate is the Bloomberg US Corporate Index. Global Agg is the Bloomberg Global-Aggregate Index. US Treasury is the Bloomberg U.S. Treasury Index. Source: Bloomberg as of 05/31/2026. Performance is not a guarantee of future results.
Chart 1, 0:41– Despite elevated volatility and rising yields, fixed income returns remain modestly positive year to date, supported by attractive starting yields and income generation that have helped offset price declines. Performance has been led by high-yield municipal bonds, which have benefitted from strong demand, resilient credit quality, and compelling taxable equivalent yields. Domestic and global high-yield markets have also performed well, benefiting from shorter duration profiles and tight credit spreads, while investment grade corporates and municipals have posted more modest gains. Notably, U.S. Treasuries have remained largely unchanged on the year as higher rates have weighed on returns.
Market Technicals Remain Well-Balanced
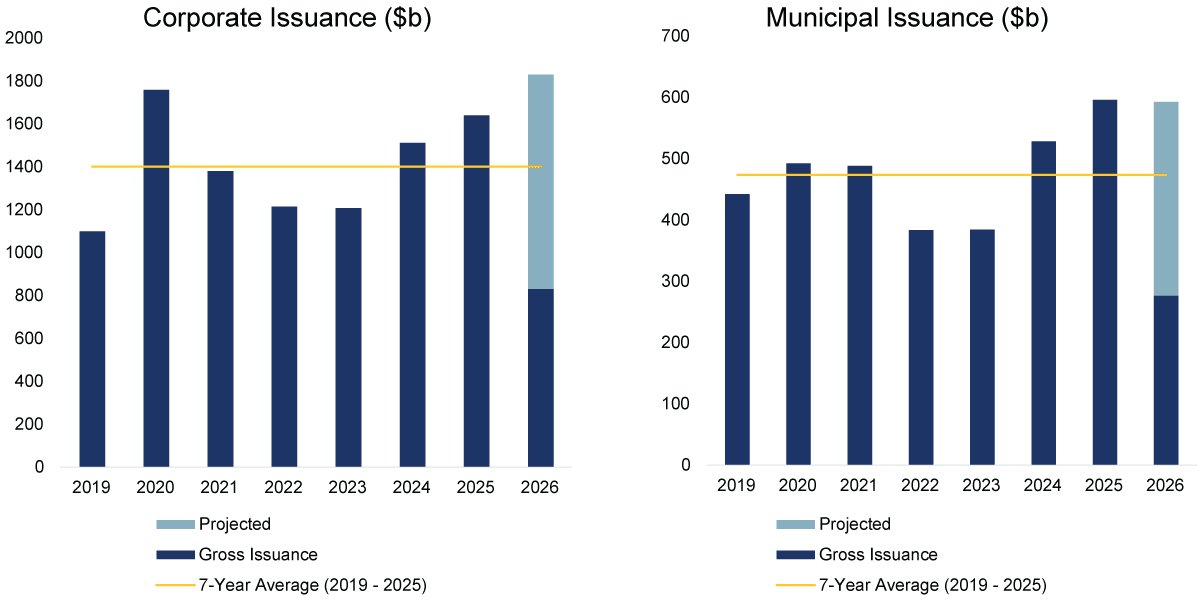
Source: Corporate – JPM, Dealogic as of 4/30/2026. Bloomberg as of 5/20/2026. Municipal – Bloomberg as of 5/31/2026. Projected is represented by annualized YTD issuance.
Information is subject to change and is not a guarantee of future results.
Chart 2, 1:23– While higher yields and income have supported returns, market technicals have been equally important this year. Despite record levels of new issuance, demand has consistently outpaced supply across both corporate and municipal bond markets, helping keep spreads tight and supporting total returns.
In the corporate sector, investment grade issuance is on pace for a record year, driven by AI-related capital spending and opportunistic refinancing. New deals have been heavily oversubscribed and often priced with minimal concessions, underscoring the depth of demand. As a result, credit spreads are near historically tight levels despite elevated rate volatility. Similarly, municipal bonds have thrived, as elevated yields have driven sustained investor demand, helping to absorb a heavy new issue calendar. The combination of resilient demand, tight spreads, and stable credit conditions has been a key return driver of performance, helping offset the headwinds from higher rates.
Fixed Income Asset Class Yields
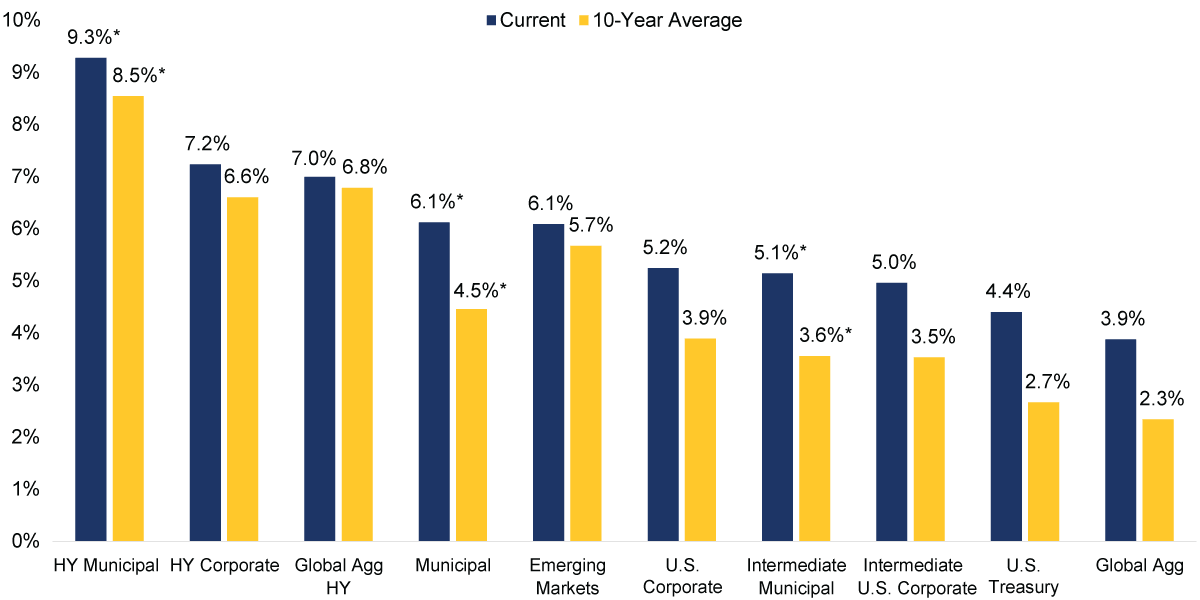
Source: Bloomberg as of 06/09/2026. HY Municipal is the Bloomberg Municipal Bond: High Yield Index. HY Corporate is the Bloomberg US Corporate High Yield Index USD. Global Agg HY is the Bloomberg Global High Yield Index. Municipal is the Bloomberg Municipal Bond Index. Emerging Markets is the Bloomberg EM USD Aggregate Index. Intermediate Municipal is the Bloomberg Municipal Bond Inter-Short 1-10Y TR Index. US Corporate is the Bloomberg US Corporate Index. Intermediate US Corporate is the Bloomberg Intermediate Corporate Index. US Treasury is the Bloomberg US Treasury Index. Global Agg is the Bloomberg Global-Aggregate Index. *Taxable Equivalent Yield – Assumes 37% Federal Tax and 3.8% Medicare surcharge. Information is subject to change and is not a guarantee of future results.
Chart 3, 2:23– Looking ahead, volatility may remain elevated as markets continue to navigate geopolitical uncertainty and an evolving economic backdrop. Our base case is that the Fed remains on hold, with the labor market showing signs of stabilization while inflation remains somewhat sticky. Further out the curve, we expect the 10-year Treasury to remain range-bound between 4.0% and 4.5%, though there is no guarantee these yields will be realized, as persistent inflation pressures, elevated government deficits, and a higher term premium continue to support longer-term yields.
For bond investors, the key takeaway is that we expect income to remain a powerful driver of returns. The reset higher in yields has created a more attractive investment landscape, with yields still above long-term averages. These higher starting yields not only provide a cushion against periods of market volatility but have historically been one of the strongest indicators of future fixed income returns.
Important Information
The views expressed represent the opinions of RBC Rochdale, LLC which are subject to change and are not intended as a forecast or guarantee of future results. Stated information is provided for informational purposes only, and should not be perceived as personalized investment, financial, legal or tax advice or a recommendation for any security. It is derived from proprietary and non-proprietary sources which have not been independently verified for accuracy or completeness. While RBC Rochdale believes the information to be accurate and reliable, we do not claim or have responsibility for its completeness, accuracy, or reliability. Actual results, performance or events may differ materially from those expressed or implied in such statements.
All investing is subject to risk, including the possible loss of the money you invest. As with any investment strategy, there is no guarantee that investment objectives will be met, and investors may lose money. Diversification does not ensure a profit or protect against a loss in a declining market. Past performance is no guarantee of future performance.
RBC Rochdale, LLC is an SEC-registered investment adviser and wholly-owned subsidiary of City National Bank. Registration as an investment adviser does not imply any level of skill or expertise. City National Bank is a subsidiary of Royal Bank of Canada.
Fixed Income investing strategies & products. There are inherent risks with fixed income investing. These risks include, but are not limited to, interest rate, call, credit, market, inflation, government policy, liquidity or junk bond risks. When interest rates rise, bond prices fall. This risk is heightened with investments in longer-duration fixed income securities and during periods when prevailing interest rates are low or negative.
High yield securities. Investments in below-investment-grade debt securities, which are usually called “high yield” or “junk bonds,” are typically in weaker financial health. Such securities can be harder to value and sell, and their prices can be more volatile than more highly rated securities. While these securities generally have higher rates of interest, they also involve greater risk of default than do securities of a higher-quality rating.
© 2026 RBC Rochdale, LLC. All rights reserved.
Index Definitions:
Bloomberg Muni and Treasury Yield Curves are graphical representations showing the relationship between interest rates (yields) and time to maturity for tax-exempt municipal bonds and taxable U.S. Treasury securities, respectively.
Bloomberg US Treasury Index measures the performance of U.S. dollar-denominated, fixed-rate, nominal debt issued by the U.S. Treasury, excluding Treasury bills, inflation-linked bonds, and STRIPS. It includes public obligations with at least one year remaining to maturity and is a key component of the broader Bloomberg Aggregate Index.
Bloomberg Municipal Bond Index is a rules-based, market-value-weighted index that measures the performance of the USD-denominated, investment-grade, long-term tax-exempt bond market.
Bloomberg Intermediate US Treasury Index measures the performance of U.S. dollar-denominated, fixed-rate, nominal debt issued by the U.S. Treasury with a remaining maturity of 1 to 10 years.
Bloomberg Short US Treasury Index measures the performance of U.S. dollar-denominated, fixed-rate, nominal debt issued by the U.S. Treasury with a remaining maturity of less than one year (specifically 1 month up to 1 year).
Bloomberg Short Municipal Bond Index is a market value-weighted index tracking investment-grade, tax-exempt U.S. municipal bonds with short-term maturities, typically ranging from one to five years.
Stay Informed.
Get our Insights delivered straight to your inbox.
Check out previous perspectives:


Put our insights to work for you.
If you have a client with more than $1 million in investable assets and want to find out about the benefits of our intelligently personalized portfolio management, speak with an investment consultant near you today.
If you’re a high-net-worth client who's interested in adding an experienced investment manager to your financial team, learn more about working with us here.
