
Videos › Economic Perspectives › August 2026
-
Economic Perspectives
The $40 Trillion Problem- Part 1 of 2
August 2026
- Filename
- Economic Perspectives August 2026.pdf
- Format
- application/pdf

TRANSCRIPT
Earlier this month, the U.S. Treasury reported that the federal government’s debt obligations passed $40 trillion.
It is a large number by any measurement, but economically speaking, it is not significant.
The reason being, it is not a surprise; the deficit has been growing each year. Three months ago, the Treasury said it surpassed $39 trillion and in a few months, it will be at $41 trillion.
Federal expenditures have been outpacing revenues for most of the post World War II period. In fact, in the eighty years since 1946, there have only been twelve years where there was a surplus, which represents about 15% of the time. Since 1970, there has only been four times that the federal government has had a surplus, representing just 7% of the time. That annual deficit has to financed. It's like living off a credit card. But by reaching a threshold like $40 trillion, it becomes a news item, and that makes it a fresh reminder that the current fiscal path is not sustainable.
Let’s look at some charts to better understand the issue.
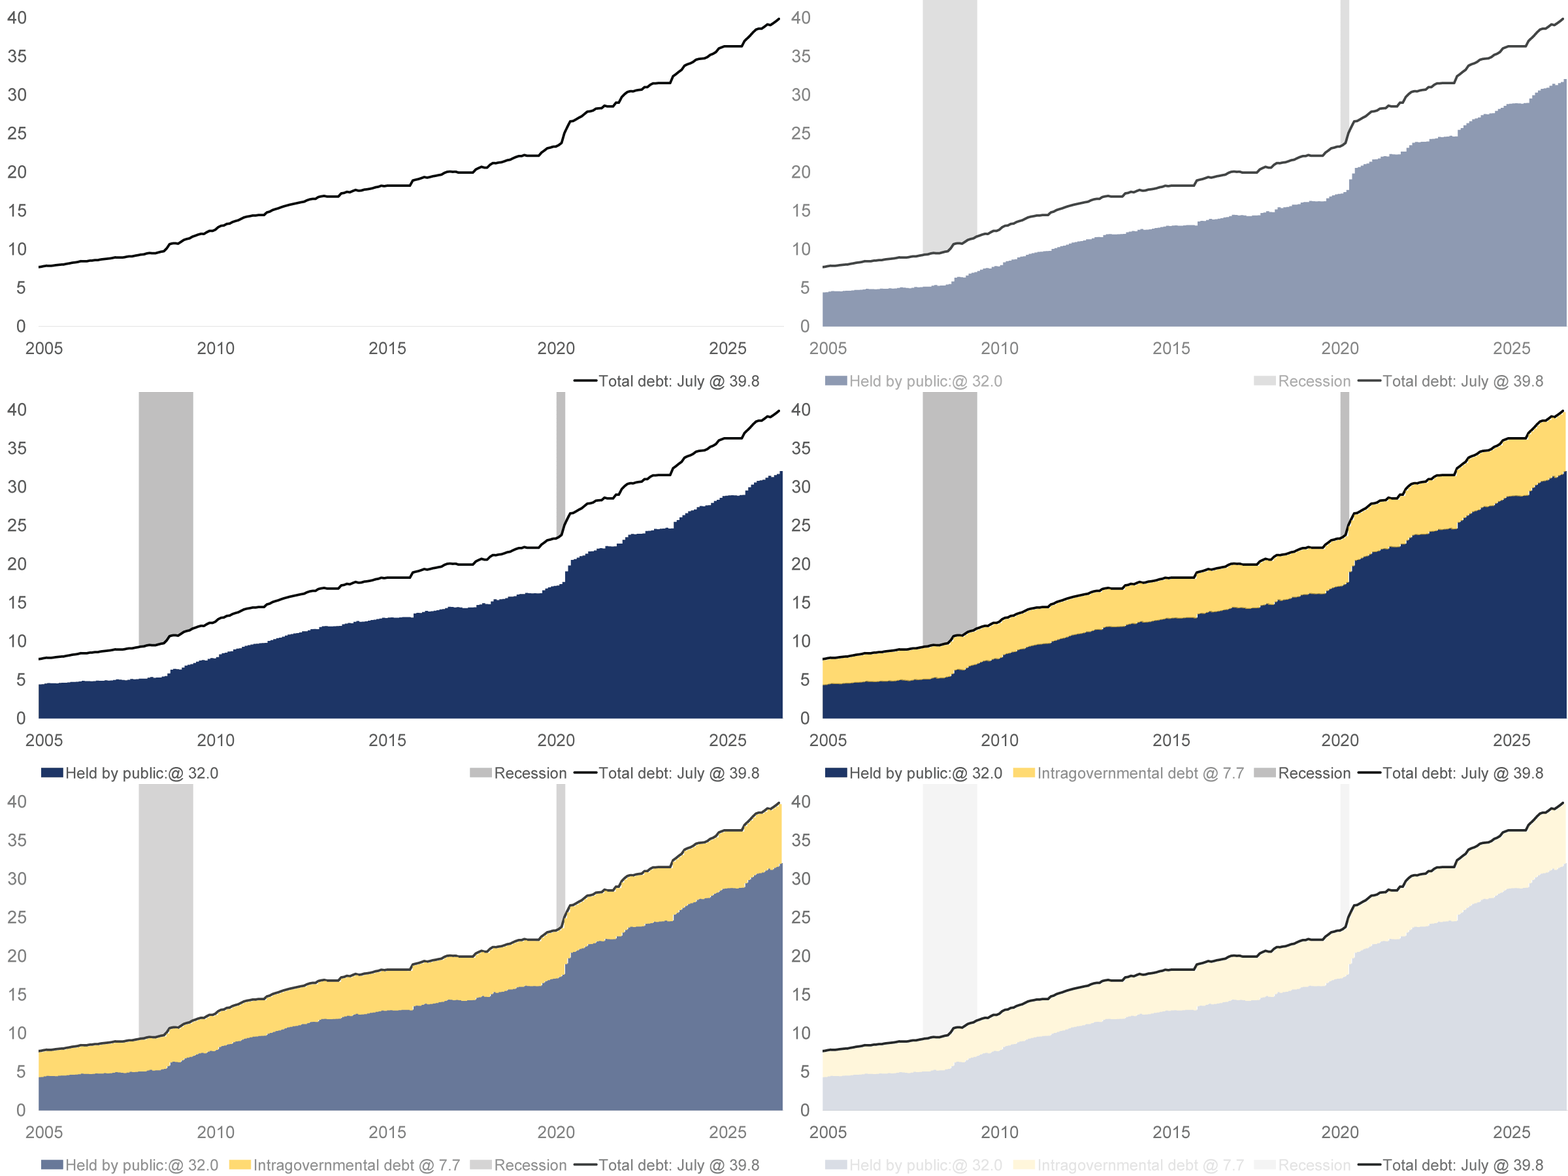
U.S. Treasury Debt Outstanding
$, trillions
Data current as of August 25, 2026
Source: U.S. Treasury
Information is subject to change and is not a guarantee of future results.
Chart 1, 1:29– This chart shows the total gross federal debt. It is monthly data, so at the end of July, it totaled $39.8 trillion. It wasn't until a few weeks later that it reached $40 trillion.
There are two types of debt. The blue area measures the amount of debt held by the public, like you, me, mutual funds, pension funds, the Federal Reserve, and foreign central banks. This totals $32 trillion and accounts for about 80% of the total debt.
The yellow area is what is called intragovernmental debt, which is owned by federal government agencies and trust funds that invest excess cash in non-marketable Treasury securities. This includes the Social Security and Medicare Trust Funds or the Highway Trust Fund. This makes up the remaining 20%.
So, what is the best way to look at the debt burden? That depends on who you are. Congress uses the gross amount to set the debt ceiling- the $40 trillion. But the CBO, the Congressional Budget Office, is a nonpartisan agency that analyzes the budget and forecasts future budgetary surpluses or deficits uses the debt owned by the public.
Most economists focus on the smaller number, the debt held by the public, as the most meaningful and proper way to measure the economic burden of the debt.
Federal Debt
$, trillions and % change year-over-year
Data current as of August 25, 2026
Source: TreasuryDirect.gov
Information is subject to change and is not a guarantee of future results.
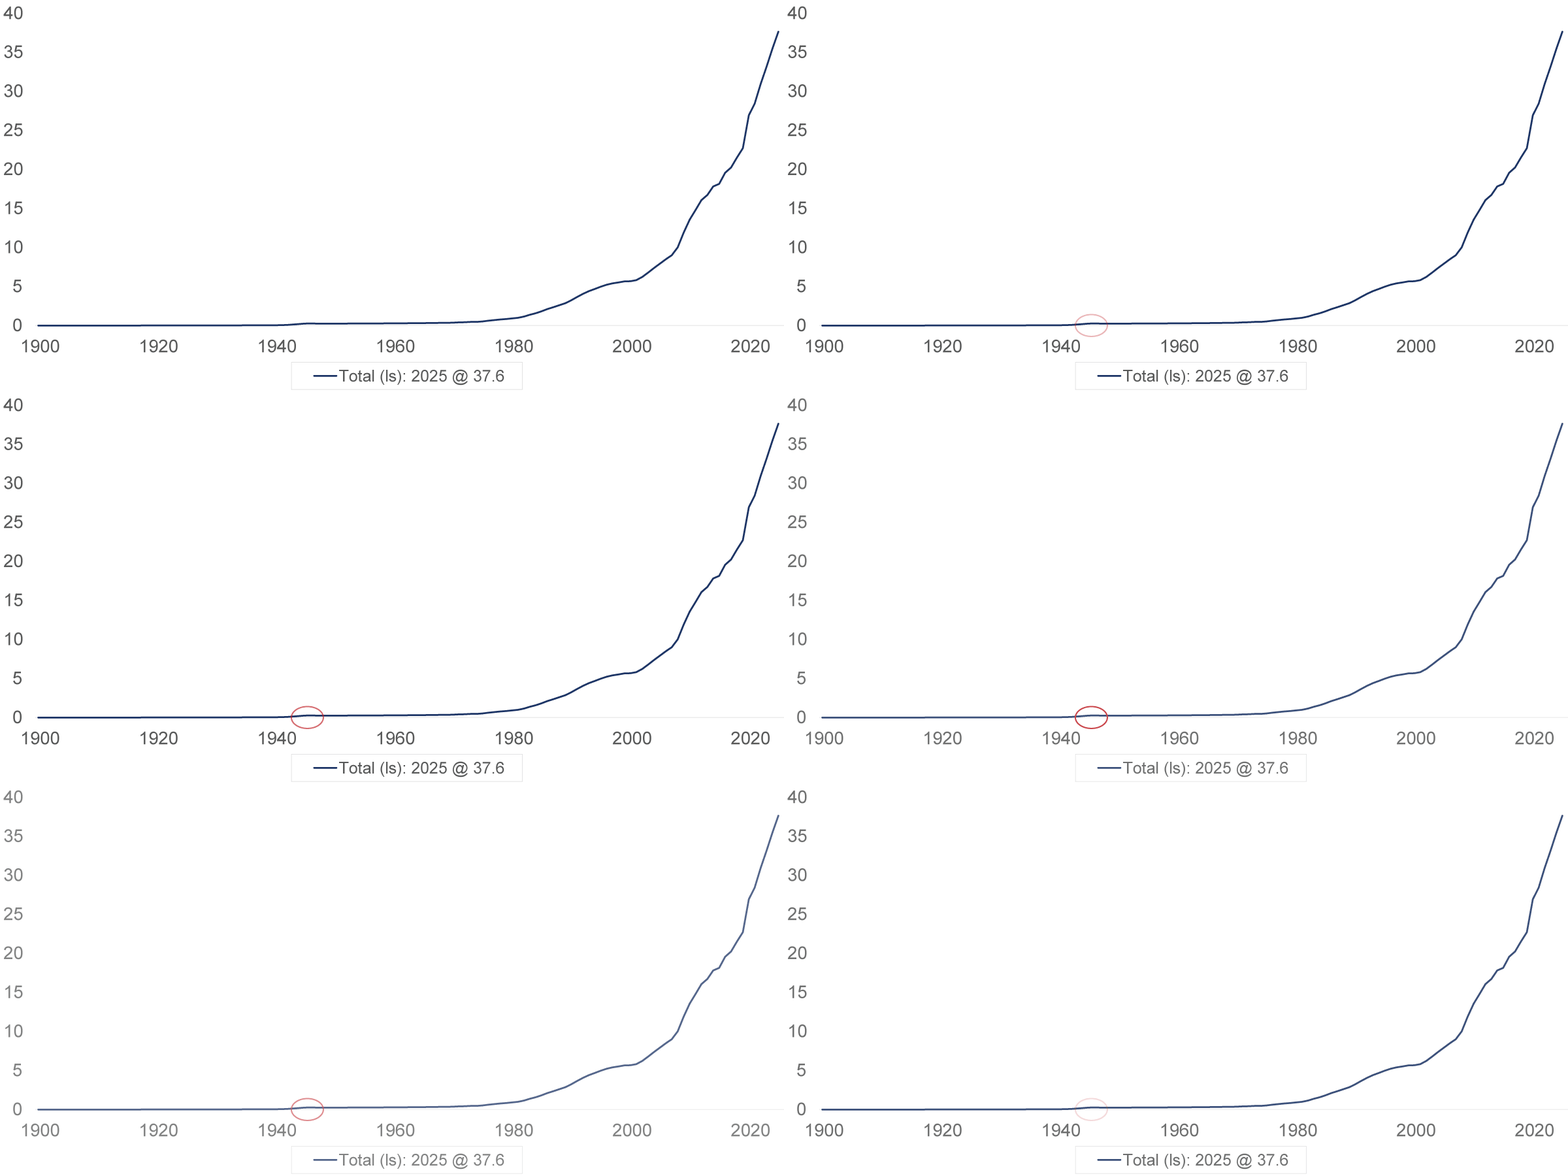
Chart 2, 2:52– The important issue when looking at the debt over a long period of time is to compare the size of the debt to the size of the economy. This chart shows why. Here is annual data on the federal debt since 1900.
The small blip in the 1940s was the increased cost of World War II. The federal debt increased from about $50 billion to about $270 billion, an increase of more than fivefold, yet it is hardly noticeable in the chart.
Federal Debt
Data current as of August 25, 2026
Source: Congressional Budget Office
Information is subject to change and is not a guarantee of future results.
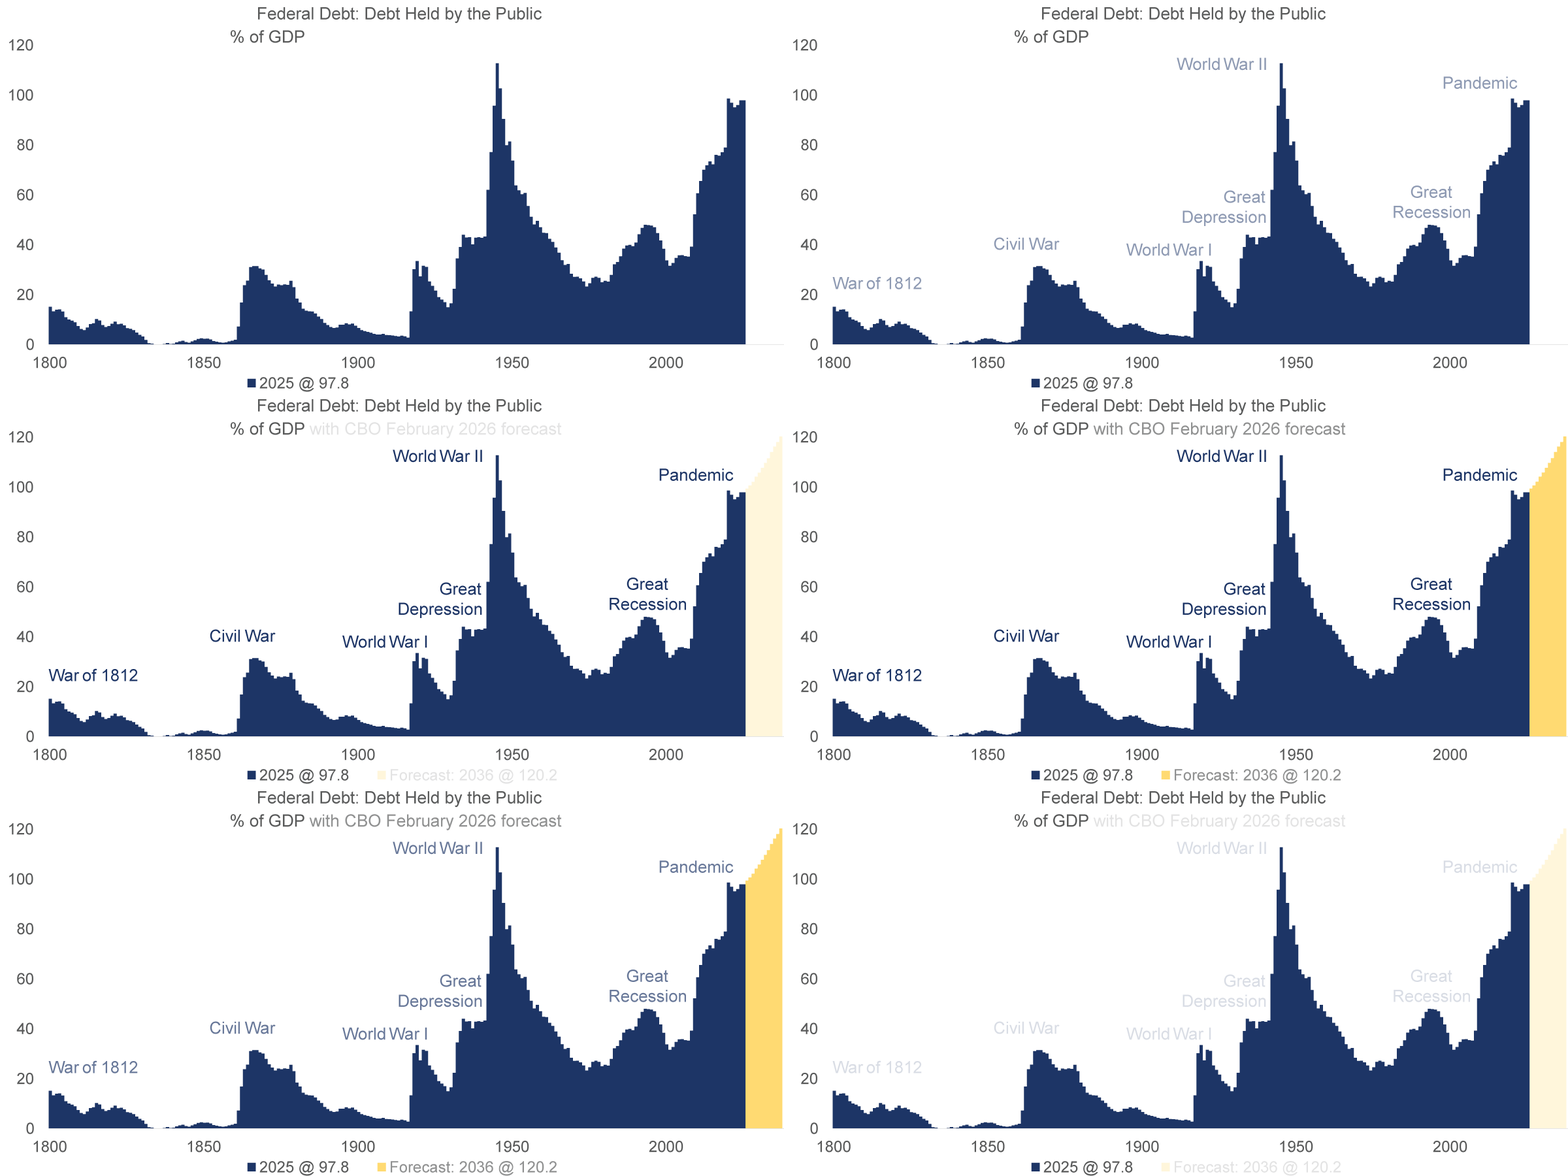
Chart 3, 3:22– The best way to look at the federal debt is to compare it to GDP, thus showing the burden the debt has on the economy and the ability to repay it.
This data goes back to 1800.
You can see how it jumps during times of war or economic hardship. This is because expenditures tend to increase and tax revenue tends to fall. After those periods, debt-to-GDP tends to decline.
The most notable is World War II, when the federal debt to GDP jumped to 113% of GDP. Yet in the ensuing years, it declined to 23% of GDP. That was not because Congress was frugal. No, it had budget deficits for almost all of those years. It is because the economy grew much faster than the debt did. Back then, the GI Bill helped train workers to have greater GDP output than the occupations they may have had before the war. From the 1950s to the 1980s, the United States was the primary manufacturer of the world. Then in the 1960s and 1970s, women were entering the workforce. Nothing grows an economy faster than more workers.
But that is not happening this time around. Increased government spending and tax cuts have kept the debt-to-GDP ratio near record levels.
The CBO forecast shows it will continue to grow. One of the major sources of growth is the interest payment that's needed to be made on that growing debt. Currently, it's around $1 trillion per year. In the next ten years, it's expected to grow to over $2 trillion per year.
U.S. Federal Debt
$, trillions, 12-months rolling total
Data current as of August 25, 2026
Source: U.S. Treasury
Information is subject to change and is not a guarantee of future results.
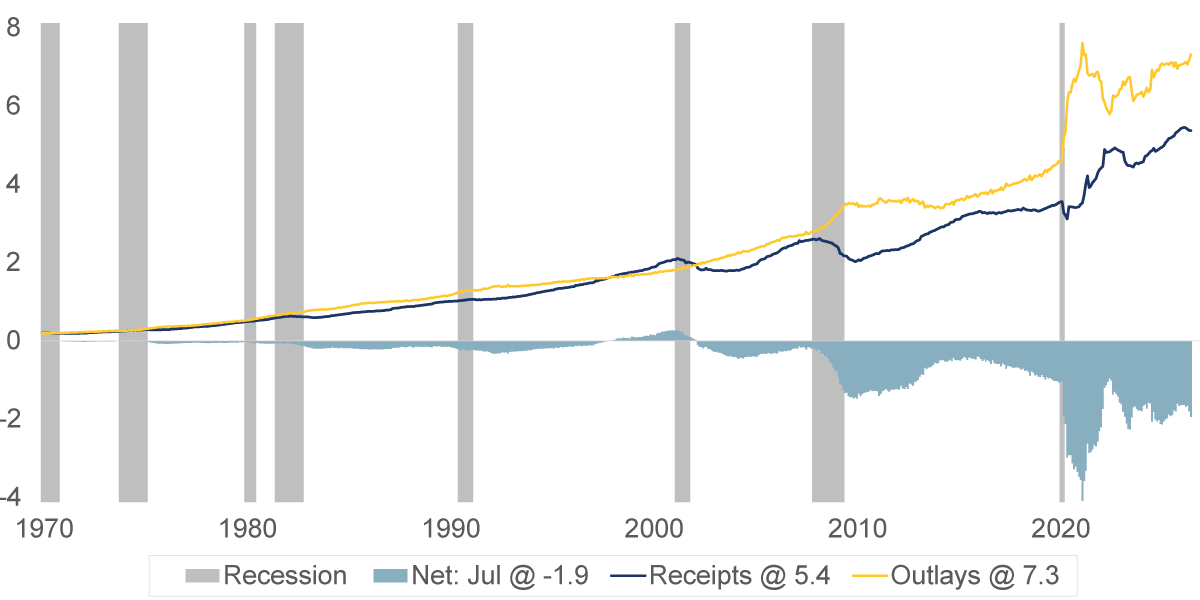
Chart 4, 5:02– This chart shows the federal outlays in yellow and receipts in dark blue. Although both are growing, outlays are growing at a much faster pace. Simply put, the government spends about seven and a half trillion dollars each year and brings in about five and a half trillion dollars. That leaves a deficit of about two trillion dollars per year.
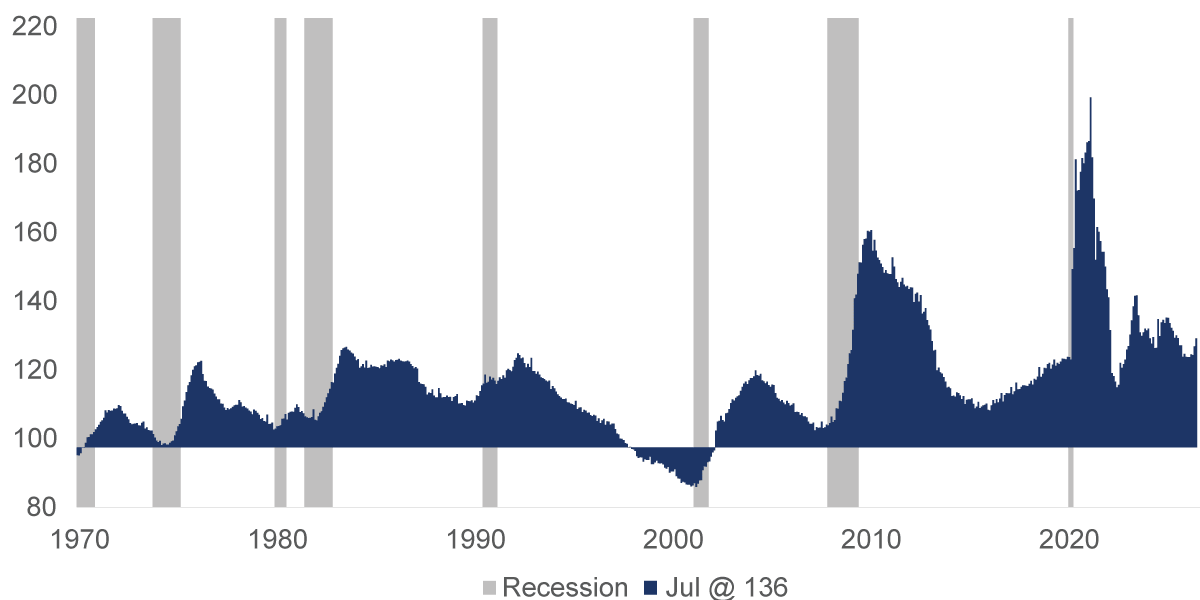
U.S. Federal Deficit: Outlays as a Percent of Revenue
%, 12-month rolling change
Data current as of August 25, 2026
Source: U.S. Treasury, RBC Rochdale Research
Information is subject to change and is not a guarantee of future results.
Chart 5, 5:24– Another way to think about it: the federal government is spending 136% of the income it brings in.
For years, economists have warned that this debt growth is not sustainable. History has taught us that high levels of spending on politically favored priorities and interest on rising debt have consistently undermined growth.
Right now, investors are pushing back on the massive amount of Treasury debt; they are demanding higher yields on the bonds they buy. This may very well be the catalyst that will make the debt an important political issue for Congress to take action toward reducing the growth rate for the debt.
This is part one of a two part series. Next month, we'll get into some of the details on where the outlays are being spent and the receipts that are helping to fund that spending.
Important Information
The views expressed represent the opinions of RBC Rochdale, LLC which are subject to change and are not intended as a forecast or guarantee of future results. Stated information is provided for informational purposes only, and should not be perceived as personalized investment, financial, legal or tax advice or a recommendation for any security. It is derived from proprietary and non-proprietary sources which have not been independently verified for accuracy or completeness. While RBC Rochdale believes the information to be accurate and reliable, we do not claim or have responsibility for its completeness, accuracy, or reliability. Statements of future expectations, estimates, projections, and other forward-looking statements are based on available information and management's view as of the time of these statements. Accordingly, such statements are inherently speculative as they are based-on assumptions which may involve known and unknown risks and uncertainties. Actual results, performance or events may differ materially from those expressed or implied in such statements.
All investment strategies have the potential for profit or loss; changes in investment strategies, contributions or withdrawals may materially alter the performance and results of a portfolio. Different types of investments involve varying degrees of risk, and there can be no assurance that any specific investment will be suitable or profitable for a client's investment portfolio.
RBC Rochdale, LLC is an SEC-registered investment adviser and wholly-owned subsidiary of City National Bank. Registration as an investment adviser does not imply any level of skill or expertise. City National Bank is a subsidiary of Royal Bank of Canada.
© 2026 RBC Rochdale, LLC. All rights reserved.
Stay Informed.
Get our Insights delivered straight to your inbox.
Check out previous perspectives:



Put our insights to work for you.
If you have a client with more than $1 million in investable assets and want to find out about the benefits of our intelligently personalized portfolio management, speak with an investment consultant near you today.
If you’re a high-net-worth client who's interested in adding an experienced investment manager to your financial team, learn more about working with us here.


 Top
Top