
Videos › Economic Perspectives › May 2026
-
Economic Perspectives
The Monthly Labor Report – A Primer
May 2026
- Filename
- Economic Perspectives May 2026.pdf
- Format
- application/pdf

TRANSCRIPT
The monthly labor report is one of the most important of any economic releases that we receive. The data serves as the economy's vital pulse, offering an immediate snapshot of its financial health. It goes beyond simple head counts, signaling whether businesses are expanding with confidence or bracing for a downturn. The Fed’s policymakers use these figures to decide on the future trajectory of interest rates. For families, it can greatly impact sentiment or confidence. If the unemployment rate decreases, households will have greater confidence in income availability and stability; they are apt to consume more, whereas a declining unemployment rate means consumers and investors are apt to guard their money and investments more closely. Because labor is the engine of consumer spending, these reports serve as the ultimate "early warning system" for the direction of the economy.
Monthly Employment Situation Report
- Establishment Survey
- Household Survey
Data current as of: May 26, 2026
Source: Bureau of Labor Statistics
Information is subject to change and is not a guarantee of future results.
Chart 1, 1:12– The Bureau of Economic Statistics releases what it calls the "Monthly Employment Situation Report" at the beginning of each month, usually on the first Friday. It is based on data for the week that includes the 12th day of the previous month. It then takes about three weeks to collect, edit and analyze the data for publishing. The report is not an actual head count, but an estimate of the number of people working.
They conduct two surveys; the larger one is commonly referred to as the Establishment Survey. This report calculates nonfarm payroll, along with other important data, such as hours worked and employee earnings. It is a monthly poll of approximately 120,000 businesses and government agencies that covers approximately 25% of all nonfarm payroll jobs. The remainder is calculated using sophisticated statistical models. Then, once a year, the BLS calibrates their data against tax records, which represent about 95% of all workers, and revise their data accordingly.
The other survey is commonly called the Household Survey. This report presents the unemployment rate, employment-to-population ratios and other demographic data. 60,000 households are contacted, usually by phone. The questions determine how many people in the household are working. It then asks if others in the household are looking for work. It does not keep track of unemployed people who are not looking for work. The unemployment rate is calculated by dividing the number of people working by the number of people looking for a job, plus those who are working, which is known as the labor force. There are differences between the two surveys. If a person has more than one job, that may show up in the Establishment Survey, but not in the Household Survey. The Household Survey includes agriculture, self-employed and paid family workers, whereas the NFP report excludes all of those groups. Now, the survey groups may seem small, given that around 160 million people are employed. But the survey is large compared to the opinion surveys we hear about on the news, which usually have 1,000 to 2,000 participants.
Nonfarm Payrolls
'000, seasonally adjusted
Data current as of: May 26, 2026
Source: Bureau of Labor Statistics
Information is subject to change and is not a guarantee of future results.
Chart 2, 3:27– Of the two reports, the non-farm payroll report is considered the most important because it is the more comprehensive. In this chart, the columns show the monthly change and the dark blue line is the six-month rolling average of the monthly data. It smooths out the data from making it easier to determine changes in the trends. As you can see, the pace of net job hires has been declining from approximately 600,000 jobs per month back in 2022, to just 55,000 in the past six months. At times last year, the six-month average was negative. Hiring workers is a positive vote of confidence in the future. When adding someone to the payroll, the employer is expecting the business to increase. But last year, with volatility with tariffs and trade, along with uncertainty over artificial intelligence and restrictive immigration policy, many businesses slowed their hiring of new workers. In the second half of the year, it was a concern for the Fed, but since the beginning of the year, job growth has stabilized in positive territory.
More importantly, it is in the range of 0-50,000 per month. That is within the range many economists think is needed to keep the unemployment rate stable.
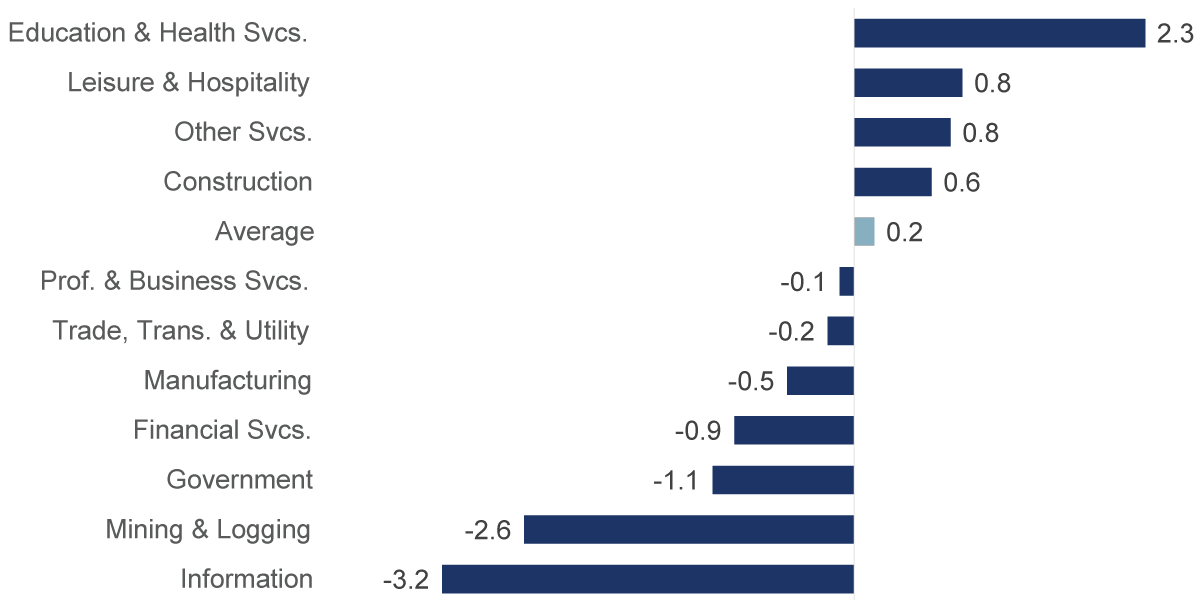
Nonfarm Payrolls: Change from 1-Year Ago
%, change seasonally adjusted, as of April 2026
Data current as of: May 26, 2026
Source: Bureau of Labor Statistics
Information is subject to change and is not a guarantee of future results.
Chart 3, 4:45– But the type of job growth is what concerns economists. This chart shows the percentage change over the past year in the number of people working in the 11 major occupations the BLS monitors. The major growth is happening in Education and Health Services and in Leisure and Hospitality. These are considered noncyclical jobs, in which employers hire regardless of where the economy is in the business cycle. There is not much hiring in occupations that drive economic growth. This is a concern.
Unemployment Rate
%, seasonally adjusted
Data current as of: May 26, 2026
Source: Bureau of Labor Statistics
Information is subject to change and is not a guarantee of future results.
Chart 4, 5:19– This chart shows the unemployment rate, currently at 4.3%, a relatively low level, below the long-term average of 5.7%. In this chart, the yellow band is 4.0% to 4.5%, a range that many economists see as full employment. It is rare for the unemployment rate to remain in or below that range for a sustained period of time. But it's happening right now, just like it did in the early 1950s and late 1960s. During those times, the United States was at war in either Korea or Vietnam. There was a draft and many young men were in the military rather than in the labor force seeking jobs, so the unemployment rate was low due to demographic factors. To some extent, demographics are keeping the unemployment rate low, as baby boomers retire faster than younger workers enter the labor force. But it is also happening because of the economy's strength.
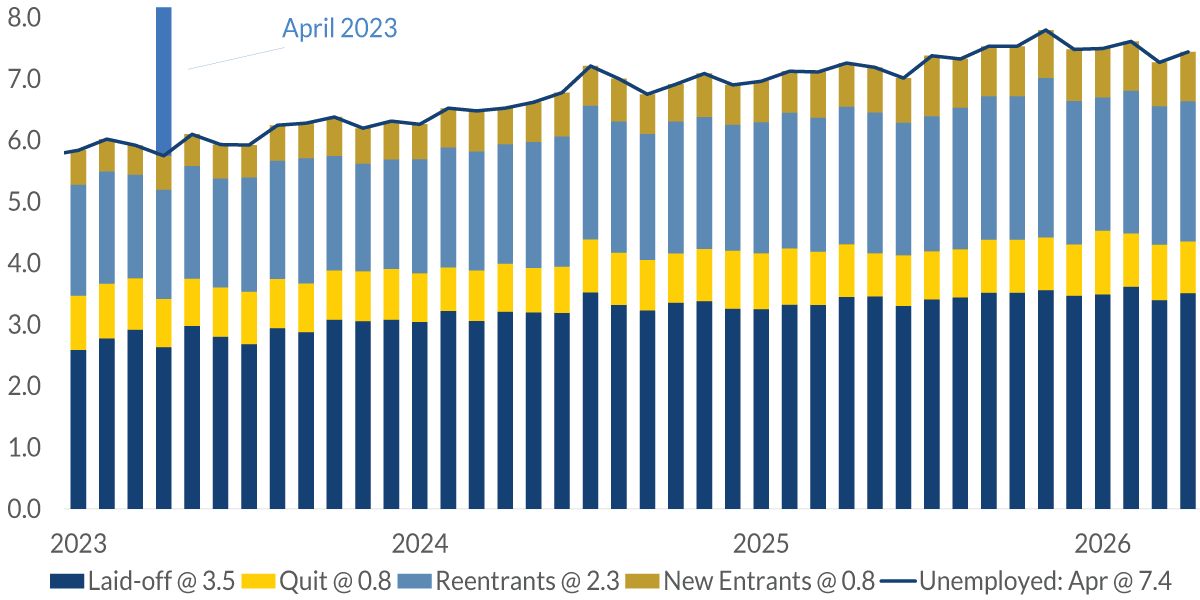
Unemployment
millions, seasonally adjusted
Data current as of: May 26, 2026
Source: Bureau of Labor Statistics
Information is subject to change and is not a guarantee of future results.
Chart 5, 6:18– With the unemployment rate at 4.3%, there are people who are unemployed; in fact, 7.4 million people are currently looking for work. That is up from 6.3 million in April 2023, when the unemployment rate was at a cycle low of 3.4%. Since then, 1.7 million more people are unemployed. Of that change, a little more than half of the unemployed have been laid off, and just under half of that is reentrance or new entrance into the job market.
The labor market could best be described as resilient but not strong. The unemployment rate is low by historical standards, but job growth is slow. And what job growth there is, isn't in the exciting go-go jobs that can alter the trajectory of the business cycle. Next month, we will look at additional labor reports that help provide a greater understanding of the health of the labor market.
Important Information
The views expressed represent the opinions of RBC Rochdale, LLC which are subject to change and are not intended as a forecast or guarantee of future results. Stated information is provided for informational purposes only, and should not be perceived as personalized investment, financial, legal or tax advice or a recommendation for any security. It is derived from proprietary and non-proprietary sources which have not been independently verified for accuracy or completeness. While RBC Rochdale believes the information to be accurate and reliable, we do not claim or have responsibility for its completeness, accuracy, or reliability. Statements of future expectations, estimates, projections, and other forward-looking statements are based on available information and management's view as of the time of these statements. Accordingly, such statements are inherently speculative as they are based-on assumptions which may involve known and unknown risks and uncertainties. Actual results, performance or events may differ materially from those expressed or implied in such statements.
All investment strategies have the potential for profit or loss; changes in investment strategies, contributions or withdrawals may materially alter the performance and results of a portfolio. Different types of investments involve varying degrees of risk, and there can be no assurance that any specific investment will be suitable or profitable for a client's investment portfolio.
RBC Rochdale, LLC is an SEC-registered investment adviser and wholly-owned subsidiary of City National Bank. Registration as an investment adviser does not imply any level of skill or expertise. City National Bank is a subsidiary of Royal Bank of Canada.
© 2026 RBC Rochdale, LLC. All rights reserved.
Stay Informed.
Get our Insights delivered straight to your inbox.
Check out previous perspectives:


Put our insights to work for you.
If you have a client with more than $1 million in investable assets and want to find out about the benefits of our intelligently personalized portfolio management, speak with an investment consultant near you today.
If you’re a high-net-worth client who's interested in adding an experienced investment manager to your financial team, learn more about working with us here.
