

Videos › Economic Perspectives › October 2026
-
Economic Perspectives
The $40 Trillion Problem- Part 2 of 2
October 2026
- Filename
- Economic Perspectives October 2026.pdf
- Format
- application/pdf

TRANSCRIPT
The Federal government’s fiscal year ended on September 30. During that period, revenues totaled about $5.5 trillion, and outlays totaled $7.5 trillion, resulting in a $2 trillion deficit.
In this month’s video, we will focus on the federal government revenue and outlays, so let’s look at some charts.
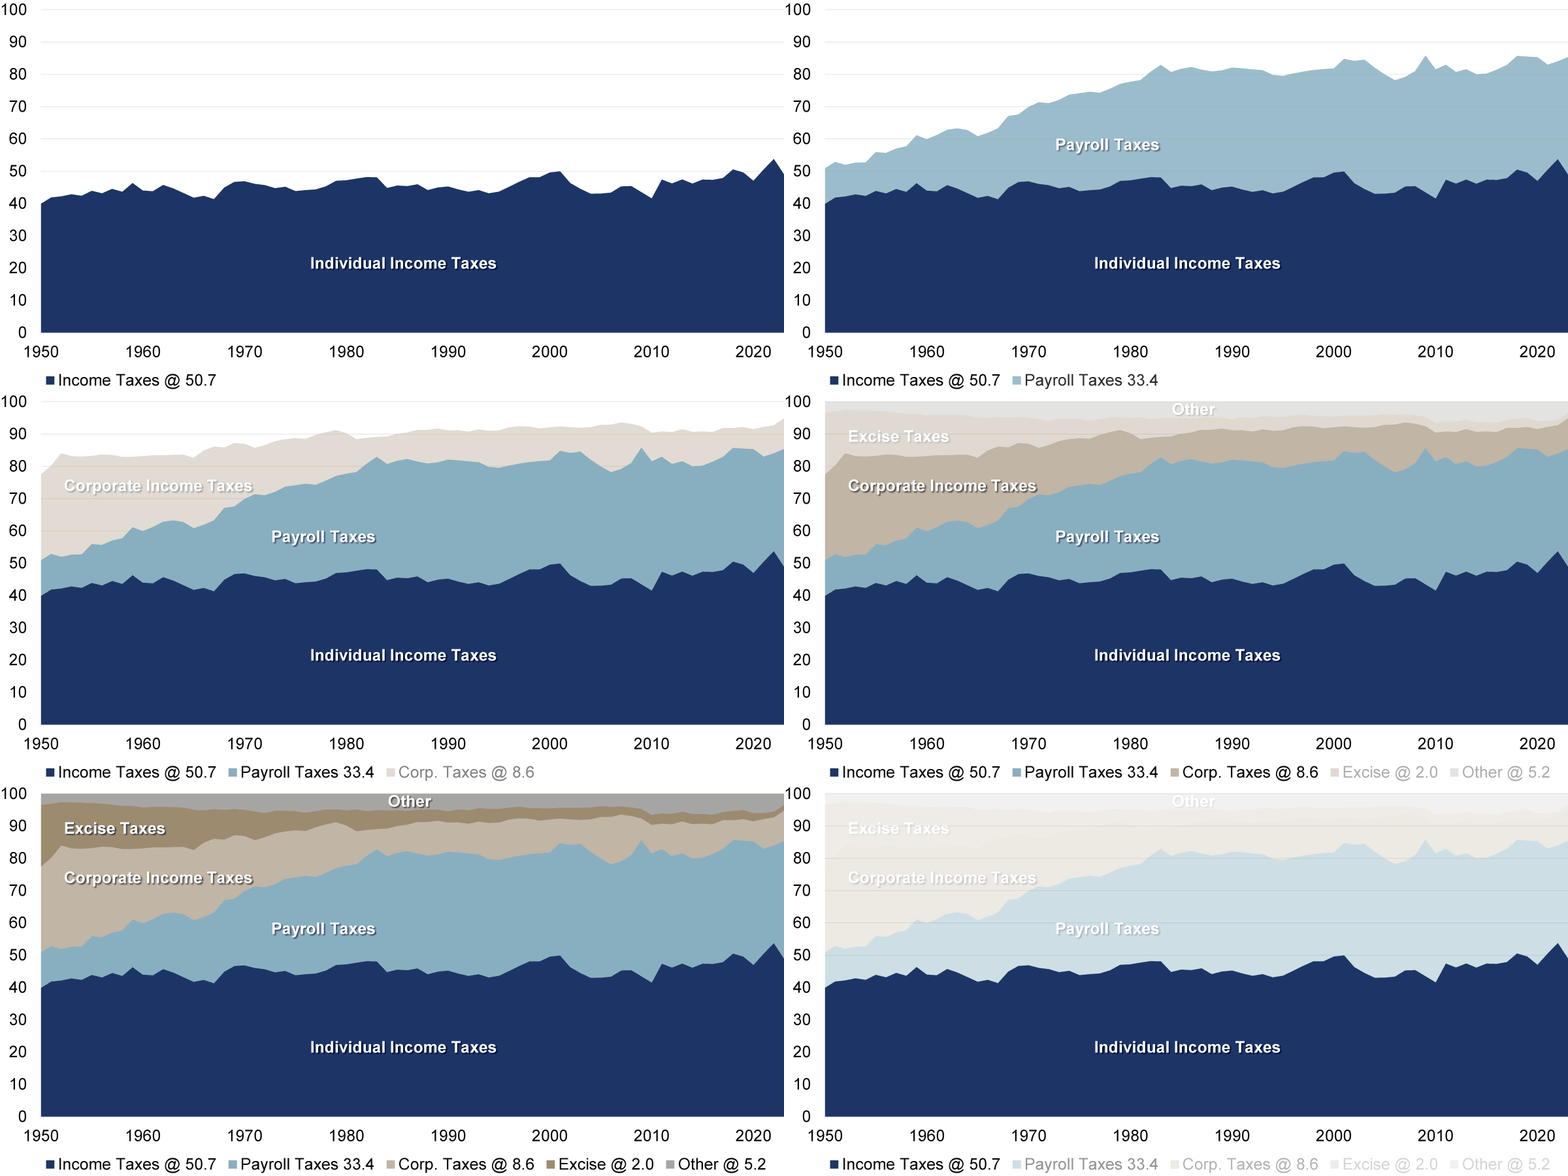
Federal Revenue: Source
% of total, as of 2025
Data current as of October 26, 2026
Source: U.S. Treasury
Information is subject to change and is not a guarantee of future results.
Chart 1, 0:37– The largest source of federal tax revenue comes from individual income taxes. That has been that case since the end of World War II. Last year, it accounted for 53% of total revenues. Over the long run, the percent of revenue coming from personal income taxes has been relatively stable, averaging 46%.
Next, Social Insurance/Payroll taxes, which is what we see on our paychecks, as FICA, account for 34% of total revenues. Payroll taxes have seen explosive growth. Since the end of World War II, as social programs expanded, including Social Security and Medicare’s creation in the mid-1960s, payroll taxes have jumped from 10% to 34%.
Corporate taxes follow, at 9%, and the remainder comes from excise, estate, tariffs and agency fees. Corporate income taxes have changed significantly; in the 1950s, the tax rate was around 50%; now, as I said, it is just 21%. There are several reasons for this.
Over the past few decades, tax laws have changed, and corporations have shifted from C corporations to S corporations. C corporations pay corporate income taxes, while S corporations are “pass-through” entities. They do not pay federal corporate income tax. Instead, their profits pass directly to the owners, who report them on their individual income tax returns. Pass-through businesses account for more than 60% of all U.S. business profits.
Legislative changes have lowered the corporate tax rate. After World War II, the tax rate peaked above 50%; it now stands at 21%. Furthermore, corporations can take many more deductions.
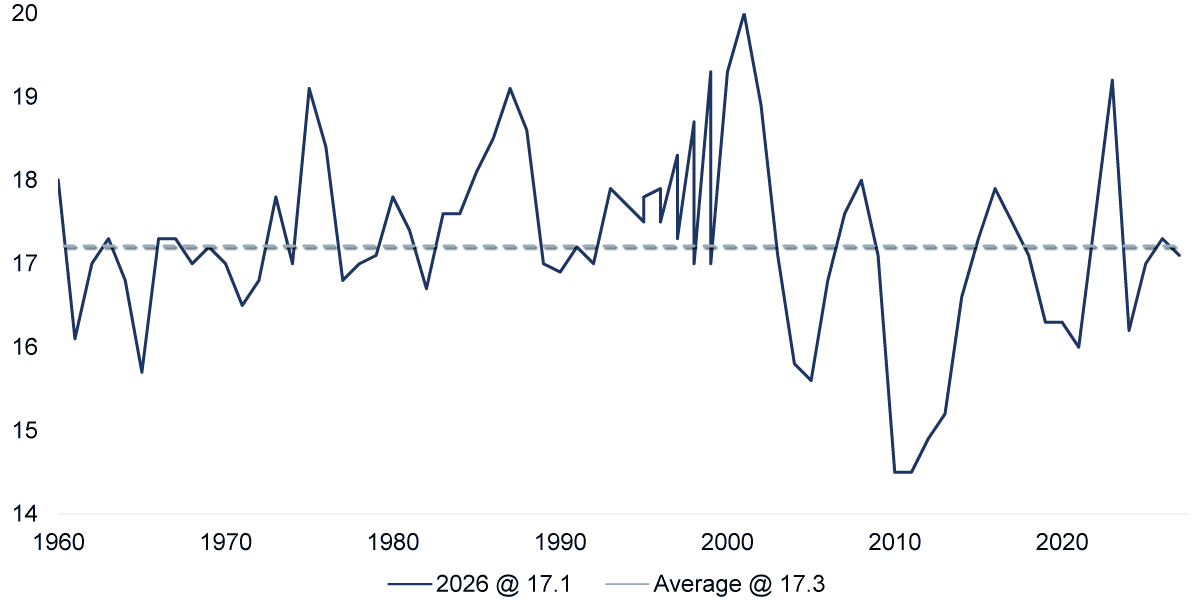
Federal Receipts: A Percent of GDP (%)
Data current as of October 26, 2026
Source: U.S. Treasury
Information is subject to change and is not a guarantee of future results.
Chart 2, 2:20– Another way to look at tax revenue is to compare it to the size of the economy. It currently stands at 18% and has deviated only slightly from its long-term average of 16.5%.
What is surprising is how steady it has been, even though the marginal tax rate has bounced around during that period, from a high of 92% in the early 1950s to the current 37%, yet tax receipts as a percentage of GDP have remained relatively constant.
This is shown in this chart. This is what is commonly known as Hauser’s Law. Kurt Hauser, the San Francisco money manager who developed it, argues that raising taxes creates several problems. It encourages taxpayers to shift, hide and underreport income. Furthermore, higher tax rates reduce the incentives to work, invent, produce and invest. In short, higher tax rates stifle animal spirits, slowing economic growth and tax revenues.
Although it is called Hauser’s Law, it is not a physical law like gravity. Instead, it is an empirical proposition.
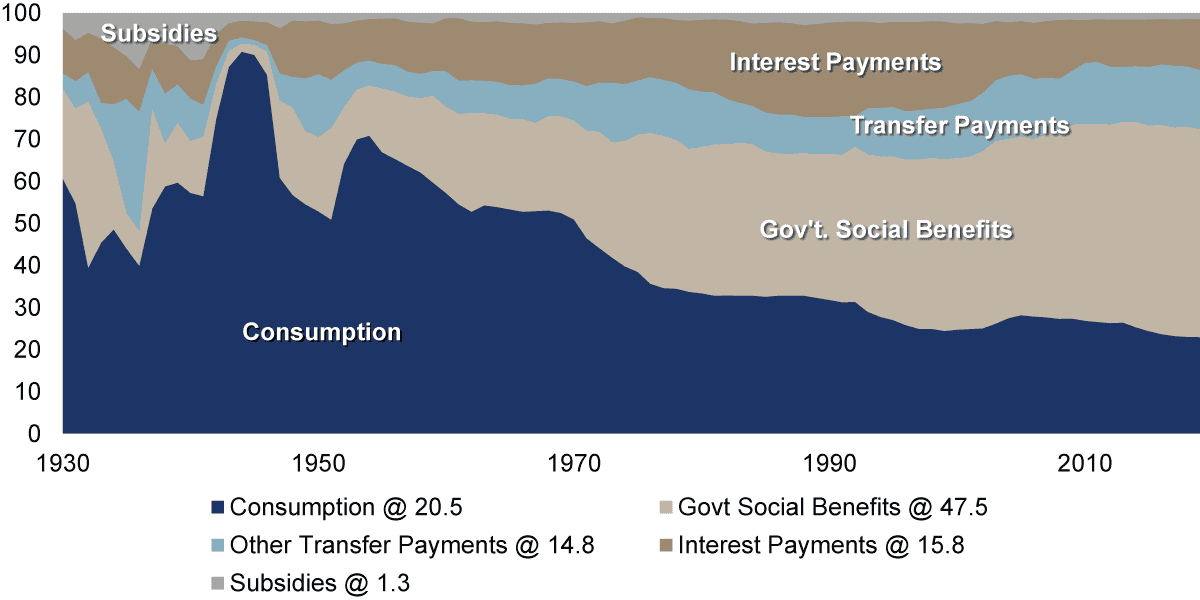
Federal Outlays
% of total, seasonally adjusted annual rate, as of 2025
Data current as of October 26, 2026
Source: U.S. Treasury
Information is subject to change and is not a guarantee of future results.
Chart 3, 3:32– Let’s talk about spending. This chart shows how spending has changed. The dark blue represents government spending; it exploded to 91% of spending in the 1940s because of World War II, but has since retreated to around 20%. Outlays for social programs like Medicare (yellow) have increased sharply and now account for almost 50% of federal outlays. Also growing, albeit more slowly, are transfer payments, another term for Social Security, and, of course, interest on the debt, which has been increasing recently because of the massive amount of debt being financed and higher interest rates.
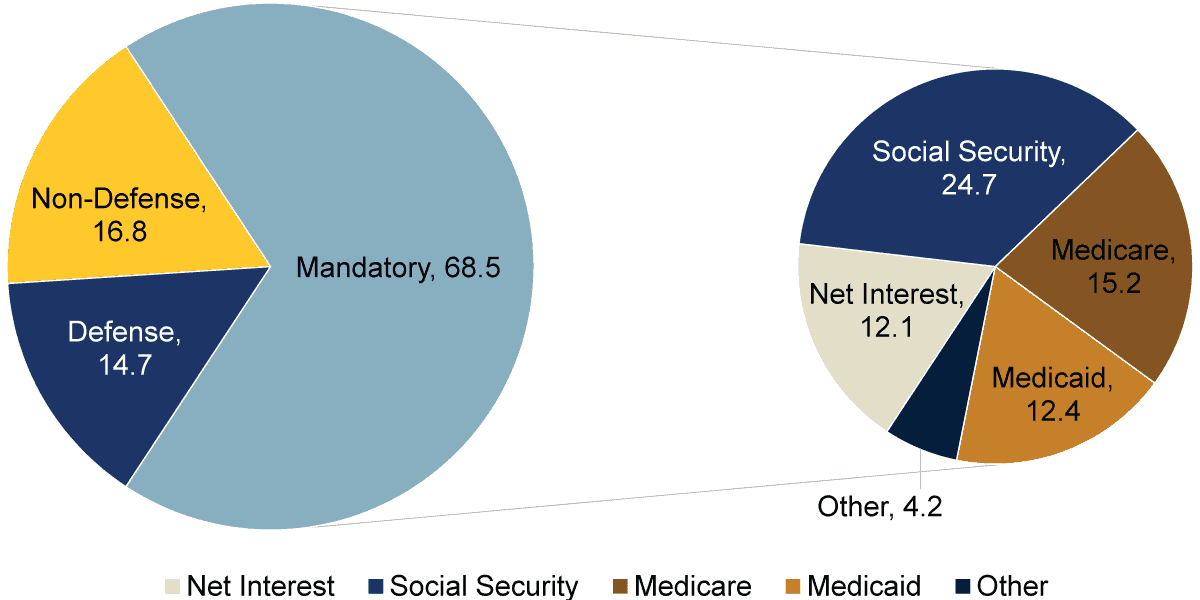
Federal Debt: Outlays
% of total, as of 2025
Data current as of October 26, 2026
Source: U.S. Treasury
Information is subject to change and is not a guarantee of future results.
Chart 4, 4:12– Another way to view outlays is to break them down into mandatory and discretionary spending. Mandatory spending does not require annual approval. Examples include Medicare, Medicaid, Social Security and federal retirement programs. Interest payments are often classified as mandatory. Mandatory spending accounts for almost 75% of federal spending. The remainder is discretionary spending, which is divided into two categories: defense and non-defense.
The federal government’s finances are on an unsustainable trajectory. Over the past few years, total debt has grown by about $2 billion per year, even during a period of economic prosperity.
The only way to correct it is to change laws to reduce the mandatory spending or to find ways to increase revenue. If the federal government eliminated all its tax breaks, it would gain an estimated $2.2 trillion in revenue, wiping out the annual deficit.
But many of the larger tax breaks exist for sound economic reasons. So, changing them isn’t easy. Right now, the deficit is not an important political issue, but, with interest rates increasing, it may become one.
Important Information
The views expressed represent the opinions of RBC Rochdale, LLC which are subject to change and are not intended as a forecast or guarantee of future results. Stated information is provided for informational purposes only, and should not be perceived as personalized investment, financial, legal or tax advice or a recommendation for any security. It is derived from proprietary and non-proprietary sources which have not been independently verified for accuracy or completeness. While RBC Rochdale believes the information to be accurate and reliable, we do not claim or have responsibility for its completeness, accuracy, or reliability. Statements of future expectations, estimates, projections, and other forward-looking statements are based on available information and management's view as of the time of these statements. Accordingly, such statements are inherently speculative as they are based-on assumptions which may involve known and unknown risks and uncertainties. Actual results, performance or events may differ materially from those expressed or implied in such statements.
All investment strategies have the potential for profit or loss; changes in investment strategies, contributions or withdrawals may materially alter the performance and results of a portfolio. Different types of investments involve varying degrees of risk, and there can be no assurance that any specific investment will be suitable or profitable for a client's investment portfolio.
RBC Rochdale, LLC is an SEC-registered investment adviser and wholly-owned subsidiary of City National Bank. Registration as an investment adviser does not imply any level of skill or expertise. City National Bank is a subsidiary of Royal Bank of Canada.
© 2026 RBC Rochdale, LLC. All rights reserved.
Stay Informed.
Get our Insights delivered straight to your inbox.
Check out previous perspectives:



Put our insights to work for you.
If you have a client with more than $1 million in investable assets and want to find out about the benefits of our intelligently personalized portfolio management, speak with an investment consultant near you today.
If you’re a high-net-worth client who's interested in adding an experienced investment manager to your financial team, learn more about working with us here.




 Top