
Turning Up the Heat
June 2026
- Filename
- Market Perspectives June 2026.pdf
- Format
- application/pdf
.jpg "Charles Boettcher, CPWA®")
TRANSCRIPT
I’ll try to keep it quick this month; after all, it’s graduation season, start of summer, World Cup…
May followed April’s upward trend with the S&P 500 advancing over 5% for the month, bringing the year-to-date total return through May 31 to over 11%. Quite the second quarter, so far. June has been bumpier as investors contend with the uncertainty of the ongoing war, inflationary pressures, recent jobs data and the growing prospect of a less accommodative Fed. If you want to discuss one thing that might spook the stock market, it’s the turning tide from expected rate cuts to talk of a rate hike. Speeches by FOMC members have turned hawkish as price pressures have been mounting. The federal funds futures market is showing a probability of a Fed rate hike this year. Conflicting views on determining the correct path of monetary policy are causing dissension among the FOMC. Many eyes will be the first Warsh-led FOMC meeting June 16 and 17.
As discussed last month, corporate earnings have been in the market’s favor. Corporate profits came in dramatically better than expected, with S&P 500 Earnings Per Share (EPS) growth rising to 29.4%, more than double the 12.4% expected at the start of earnings season. Tech-led investment remains a powerful economic engine, as Technology EPS growth reached 56.0%, supported by AI demand, capital spending, and continued revenue growth across the sector. Encouragingly, it is not just tech; the EPS growth rate ex-technology is currently 21.57%. Only in the healthcare sector are earnings negative. This level of profits has kept the expansion rolling.
International Markets: Volatility Today, Structural Opportunity Ahead
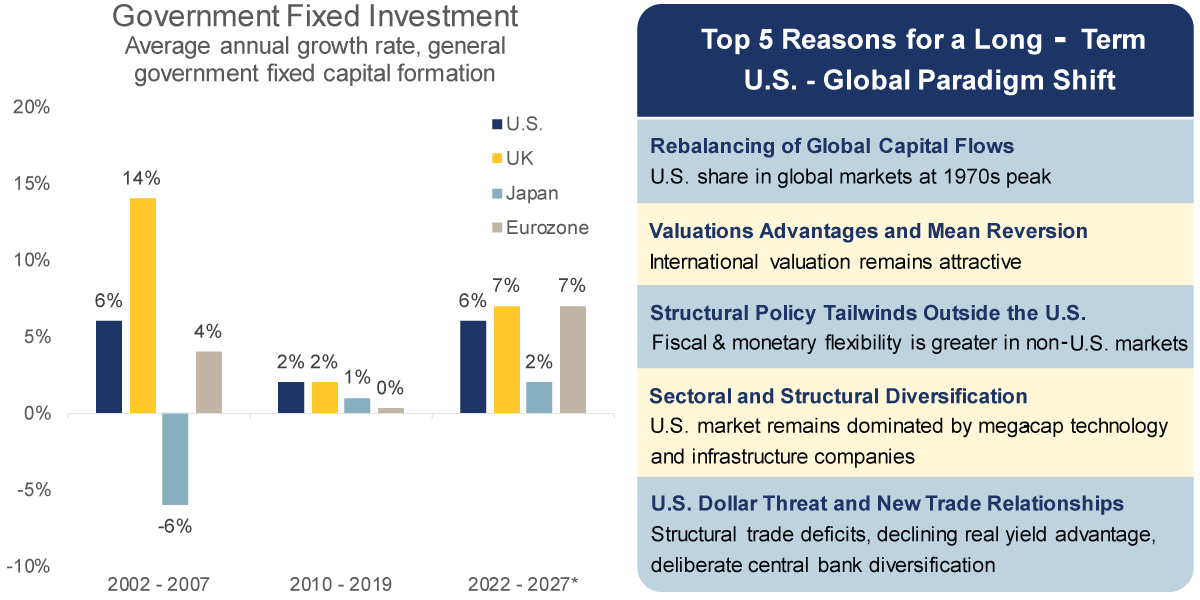
“*2022 to 2027 includes OECD forecasts. Eurozone is a GDP-weighted average of France, Germany, Italy and Spain. General government fixed capital formation is investment by government entities in long-term assets such as infrastructure, buildings, machinery and equipment, intended to support public services and economic development.” JPM Guide to the Markets. Source: RBC Rochdale, JPM Guide to the Markets, Bloomberg. As of May 29, 2026.
Information is subject to change and is not a guarantee of future results.
Chart 1, 2:13— Let's look overseas. Outside of the U.S., the war has thrown some short-term cold water on our stance that portfolios should have an allocation to International Developed equities; however, our longer-term case for non-U.S. stocks remains. The right-hand side of this chart notes the top five reasons for our longer-term positive outlook.
- Capital flows
- Valuation
- Relative policy tailwinds
- Diversification
- Dollar challenges
Stocks from Here: Bull vs. Bear
Source: RBC Rochdale. As of May 31, 2026.
Information is subject to change and is not a guarantee of future results.
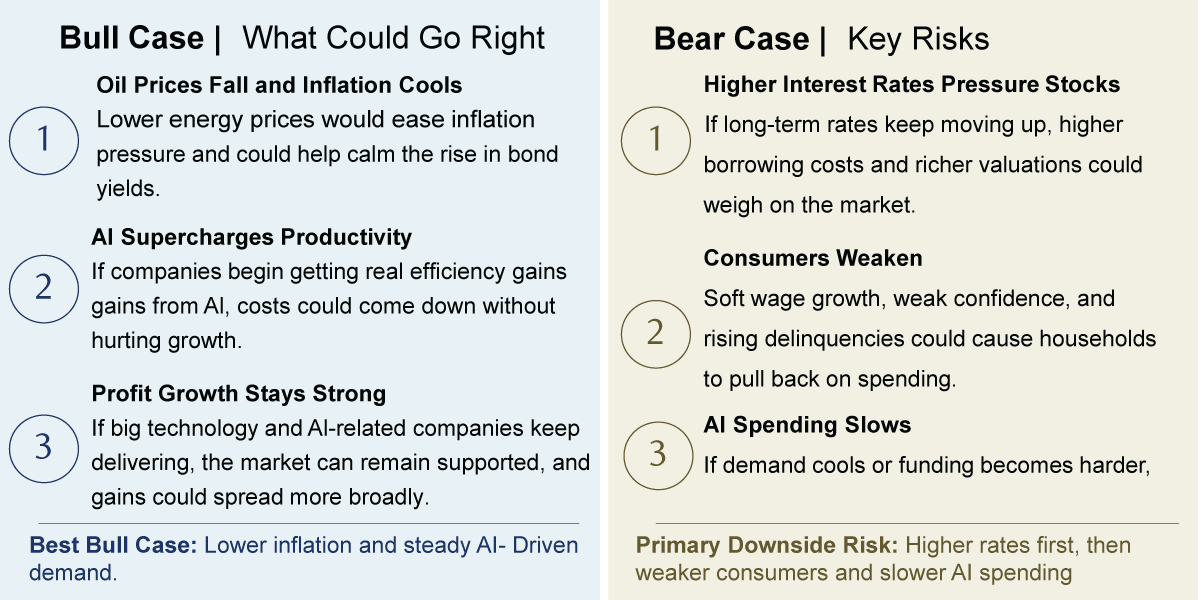
Chart 2, 2:44— So, what’s the outlook for the second half of 2026? As we’ve noted, strong corporate profits and AI-related demand have outweighed higher inflation and interest rate concerns. What could go right, and what are the risks to an optimistic outlook? The outcome relies heavily on AI demand. If inflation pressures ease, and AI demand remains steady, then the outlook is positive, especially if corporate profit growth stays supportive. If rates rise and stay higher, the consumer weakens, and AI spending slows, then we might experience a pullback before seeing new highs.
To sum up:
- The outlook remains constructive, but not without risks.
- Inflation is creating pressure from multiple directions.
- Business momentum is building.
- Stocks can keep the rally going if profits and productivity offset higher rates.
What Drives Equity Markets From Here?
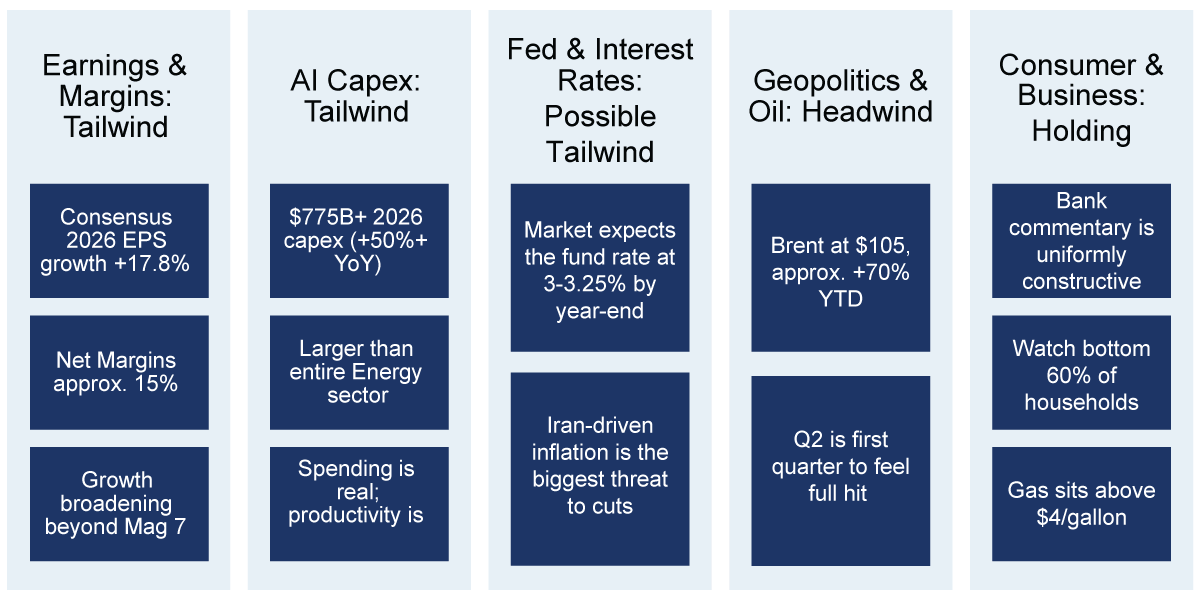
Source: Bloomberg, RBC Rochdale. As of April 24, 2026.
Information is subject to change and is not a guarantee of future results.
Important Information
The views expressed represent the opinions of RBC Rochdale, LLC which are subject to change and are not intended as a forecast or guarantee of future results. Stated information is provided for informational purposes only, and should not be perceived as personalized investment, financial, legal or tax advice or a recommendation for any security. It is derived from proprietary and non-proprietary sources which have not been independently verified for accuracy or completeness.
While RBC Rochdale believes the information to be accurate and reliable, we do not claim or have responsibility for its completeness, accuracy, or reliability. Statements of future expectations, estimates, projections, and other forward-looking statements are based on available information and management's view as of the time of these statements. Accordingly, such statements are inherently speculative as they are based on assumptions which may involve known and unknown risks and uncertainties. Actual results, performance or events may differ materially from those expressed or implied in such statements.
All investing is subject to risk, including the possible loss of the money you invest. As with any investment strategy, there is no guarantee that investment objectives will be met and investors may lose money. Diversification does not ensure a profit or protect against a loss in a declining market.
Equity investing strategies & products. There are inherent risks with equity investing. These risks include, but are not limited to stock market, manager or investment style. Stock markets tend to move in cycles, with periods of rising prices and periods of falling prices.
RBC Rochdale, LLC is an SEC-registered investment adviser and wholly-owned subsidiary of City National Bank. Registration as an investment adviser does not imply any level of skill or expertise. City National Bank is a subsidiary of Royal Bank of Canada.
Index Definitions
The Standard & Poor’s 500 Index (S&P 500) is a market capitalization-weighted index of 500 common stocks chosen for market size, liquidity and industry group representation to represent U.S. equity performance.
The Magnificent Seven (Mag 7) refers to a group of seven high-performing, dominant U.S. technology stocks—Alphabet, Amazon, Apple, Meta, Microsoft, Nvidia, and Tesla.
EPS (Earnings Per Share) is a key financial metric representing a company’s profit divided by its outstanding shares, indicating profitability per share.
Stay Informed.
Get our Insights delivered straight to your inbox.
Check out previous perspectives:
Put our insights to work for you.
If you have a client with more than $1 million in investable assets and want to find out about the benefits of our intelligently personalized portfolio management, speak with an investment consultant near you today.
If you’re a high-net-worth client who's interested in adding an experienced investment manager to your financial team, learn more about working with us here.
